March 2019 Middle East Speed Ranking Report

Summary

In this analysis of speed test results taken in countries in the Middle East during February 2019 we compare download speeds between countries, between MNOs & ISPs within each country and also compare how performance varies across different subsidiaries of the major Telecom Groups.

Key Insights

  • Middle East average download speed: 7.3 Mb/s

  • Turkey, Qatar, Bahrain and Jordan have above average download speeds

  • Egypt and Kuwait have the slowest download speeds

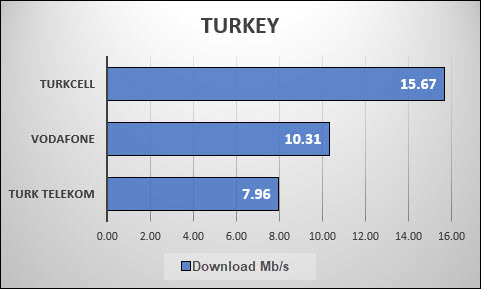
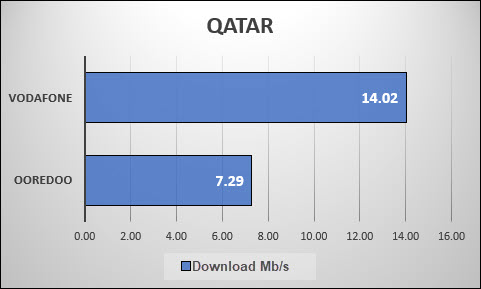
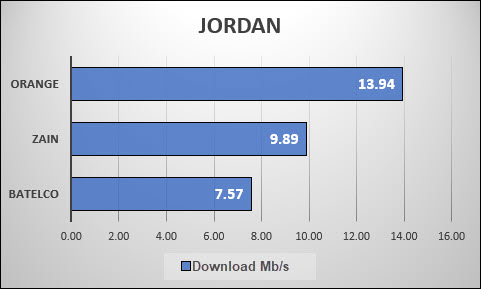
  • Vodafone in Qatar, Orange in Jordan and Vodafone Turkey are the fastest amongst MNOs & ISPs with download speeds over 10 Mb/s

  • Inconsistent CDN peering impacts user experience

Country Ranking

Regional average download speed is 7.3 Mb/s.

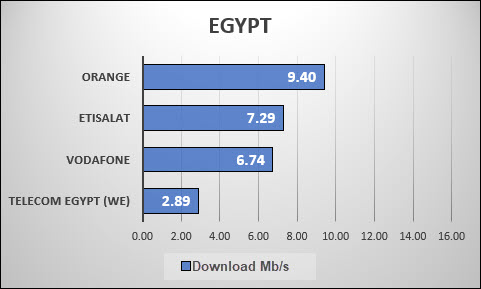
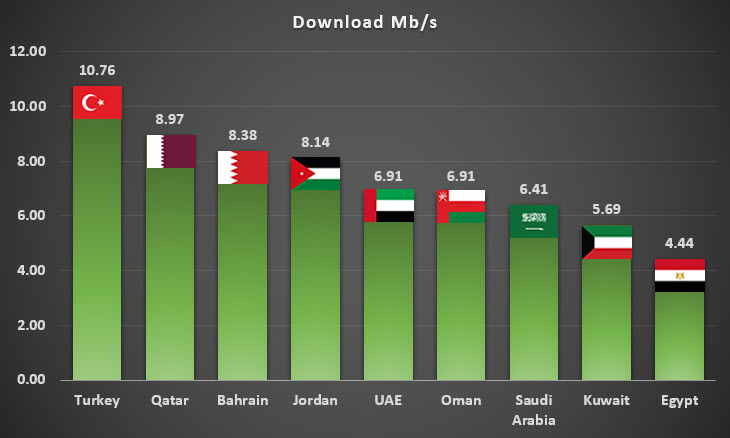
Turkey (10.7 Mb/s), Qatar (9.0 Mb/s), Bahrain (8.4 Mb/s) and Jordan (8.1 Mb/s) top the chart with above Middle East average download speeds. Egypt (4.4 Mb/s) and Kuwait (5.7 Mb/s) have the poorest performance in our tests. These speeds are represented in the following chart.

compare_download_do

How Telecom Groups Perform in Different Countries

There are a number of international MNOs & ISPs that offer services in more than one Middle East country:

Telecom Group Number of
Countries
Countries

Batelco

2

Bahrain and Jordan

Etisalat

3

Egypt, Saudi Arabia and United Arab Emirates

Link.Net

2

Egypt and Jordan

Ooredoo

3

Kuwait, Oman and Qatar

Orange

2

Egypt and Jordan

STC / Viva

3

Bahrain, Kuwait and Saudi Arabia

Vodafone

3

Egypt, Qatar and Turkey

Zain

4

Bahrain, Jordan, Kuwait and Saudi Arabia

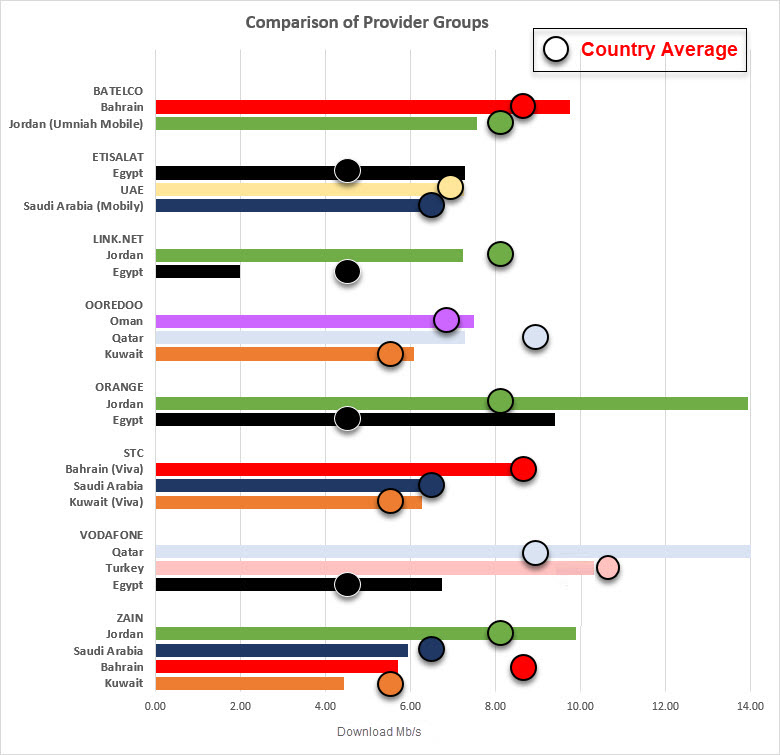
Our next chart superimposes the average speed for each country with the speeds for each Telecom Group so that we can see which Groups produce above or below average in each country that they operate in. Each country is given a unique colour in the following chart to allow a visual comparison of speeds for different Telecom Groups in each country.

Most Telecom Groups outperform the average in each country with the following exceptions:

  • Batelco in Jordan

  • Link.net in Jordan and Egypt

  • Ooredoo in Qatar

  • Vodafone in Turkey

  • Zain in Saudi Arabia, Bahrain and Kuwait

provider_groups_colours_circles

Top MNOs & ISPs in each Country

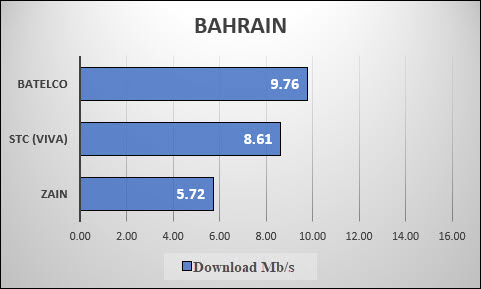
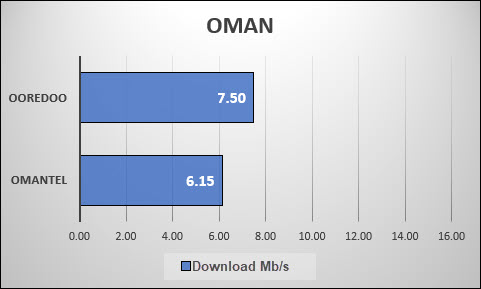
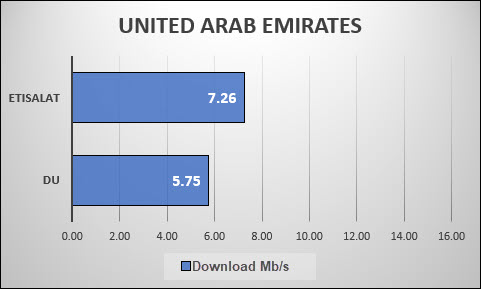
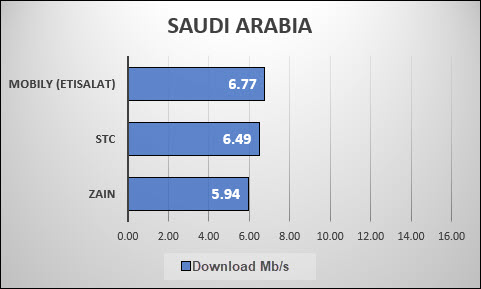
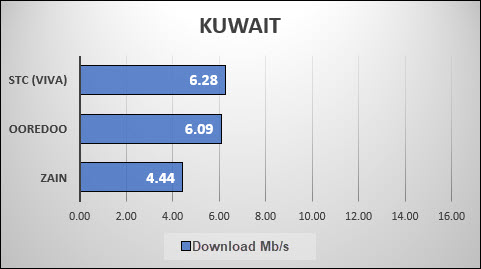
In this section we look at how the most popular MNOs & ISPs perform in each country. The charts are in order of the fastest available download speeds with a consistent scale of up to 16 Mb/s to make comparison easier.

turkey16
qatar16
jordan16
bahrain16
egypt16
oman16
uae16
sa16
kuwait16

SpeedChecker Measurement Methodology

Data Collection

SpeedChecker collected data in all countries during the same period in February 2019 to ensure a fair comparison. We gathered many data points using the crowd sourced data samples collected in the field on mobile devices. During the time the data collection took place, SpeedChecker received over 60,000 data samples and the included statistics and analysis are based on this dataset.

It was important for us to not only measure the real speeds as experienced by the user but also to ensure that we measured to the same point to ensure a fair comparison. For this we included only measurements to one server in Amsterdam. Read the following section “Choice of measurement server” for more about this method.

Choice of measurement server

Every measurement methodology differs in the selection of measured server infrastructure. Some methodologies focus on on-net servers hosted in telecom premises and others focus off-net. SpeedChecker believes off-net servers’ measurements are representing real user experience better than on-net as most of the content accessible by end users lies off-net. Most of the content these days is hosted on CDN networks and the best way to measure most relevant download metrics is to choose popular CDN networks. However, as we learn in this report, not all ISPs and MNOs connect to CDNs directly (or peer) and that has major implications on performance.

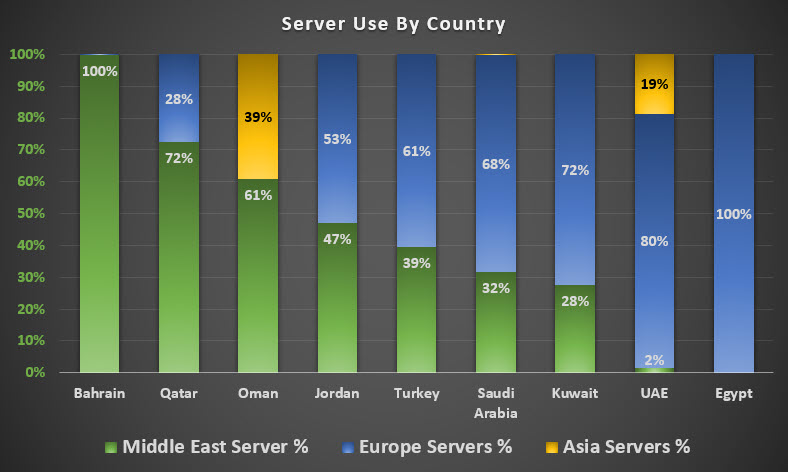
One of the main advantages of CDN peering is to improve connection time and download speeds by bringing the content closer to the end user. Before we could analyse the speed results, we considered how widespread peering was and discovered that there was a variation between 0 and 100% use of local servers.

server_use_chart

The chart above shows the percentage of results from each country that are routed via local Middle East Servers, Europe or Asia. Bahrain, Qatar and Oman are all above 50% Middle East server use with Bahrain at 100%. United Arab Emirates and Egypt have a very low use of local servers. In our case we have used the most popular CDN – Cloudflare.

Speeds achieved to local servers were, on average, around 30% faster than speeds routed via European servers but this is not available to the majority of users. Because of the unbalanced availability of this CDN peering we chose to limit our analysis to results from one particular server based in Amsterdam, Europe.


  • No country will have an unfair advantage as would be the case if local servers were used

  • The majority of content is still hosted in Europe which means the download speeds reflect actual usage for most of the content downloaded by the end user

It is acknowledged that the operators in some countries that are peering with CDNs will achieve better results than those shown in this report.
Analysis of Fibre and 4G Deployment in Riyadh

This is a report on the state of Fibre and 4G deployment in Riyadh based on data points collected by Speedchecker in September 2018. The report discusses the state of Fibre and Mobile coverage (the extent of coverage and the quality of service) and the Speedchecker Measurement Method. The conclusion shows how Riyadh is placed to take advantage of future improvements to networks.

Current Network Coverage in Riyadh

Summary of Network Coverage

The three main Internet providers in Riyadh are STC, Mobily and Zain. Only STC provide services over 4G, Fibre AND Copper. Mobily offer 4G and Fibre and Zain provide 4G but not Fibre or Copper. Riyadh has excellent 4G coverage and Fibre is well established in the centre of the city and plans are well underway to extend the coverage to the main city areas. Fibre beyond the main city areas is planned but not currently in progress.

coverage_summary

Fibre Coverage

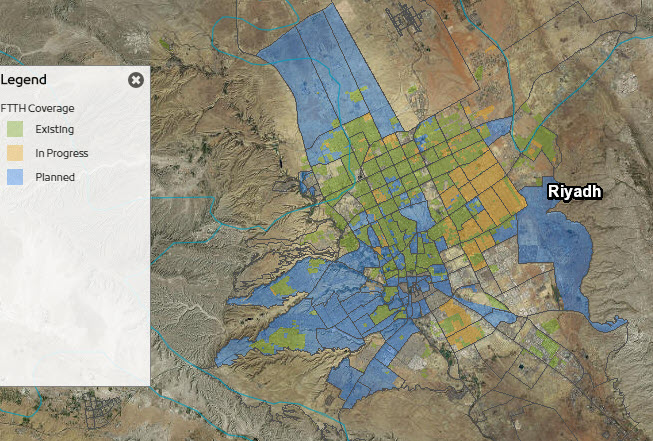
Fibre is widely available across Riyadh particularly in and close to the centre. The map shown below shows that coverage is poor in the South-West of the city and in the rural areas surrounding the city.

Fibre is provided by STC and Mobily with Mobily exclusively covering the South-West and ITC the North-East. Other existing areas are covered jointly by STC and Mobily.
The In Progress areas (yellow on the map) are either STC or ITC with some coverage being provided by Dawiyat.

Zain has no fibre coverage in Riyadh as at October 2018.

riyadh_ftth_coverage

Fibre To The Home (FTTH) Coverage in Riyadh (January 2018)
Source: MCIT (https://www.mcit.gov.sa/en/wbsira-map)

4G Coverage

Riyadh has excellent 4G coverage with 4G being available in all urban districts and along the length of the main roads going into and out of the city.

Speedchecker Measurement Method

Speedchecker uses the billions of data points collected through its passive and active measurement technologies worldwide to provide insights to our customers. This is used by businesses to improve their service and by research establishments to provide invaluable information.

Each data point consists of many KPIs including speed, latency, location, connection type, device info. Our results focus on speed and latency as experienced on the device to provide insightful information on Quality of Service. More detail about the Speedchecker Measurement Method.

This data is then integrated into our customizable map-based dashboards for geospatial analysis.

STC Fibre Coverage

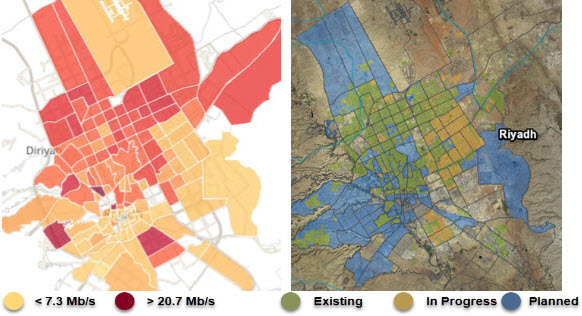
Riyadh has an ongoing plan to implement fibre broadband across the city. Our results clearly show a correlation between the speeds achieved in districts that have fibre and those that do not.

We analysed the fibre results from STC to see if they correlated with the rollout of fibre across Riyadh. Our results on the left show high-speed results in Red / dark orange and slower results in yellow / light orange. These can be compared with the green areas from the MICT rollout plan where fibre is already available and the yellow areas where it is in process. The blue areas show areas that are planned but not yet in process and it is in these areas that the speeds are low.

riyadh_ftth

We are still analysing the results from Mobily fibre and will publish when the analysis is complete.

State of Riyadh Mobile Networks

Speed result data points collected from Riyadh in September 2018 were analysed and allowed the top 3 mobile providers to be compared.

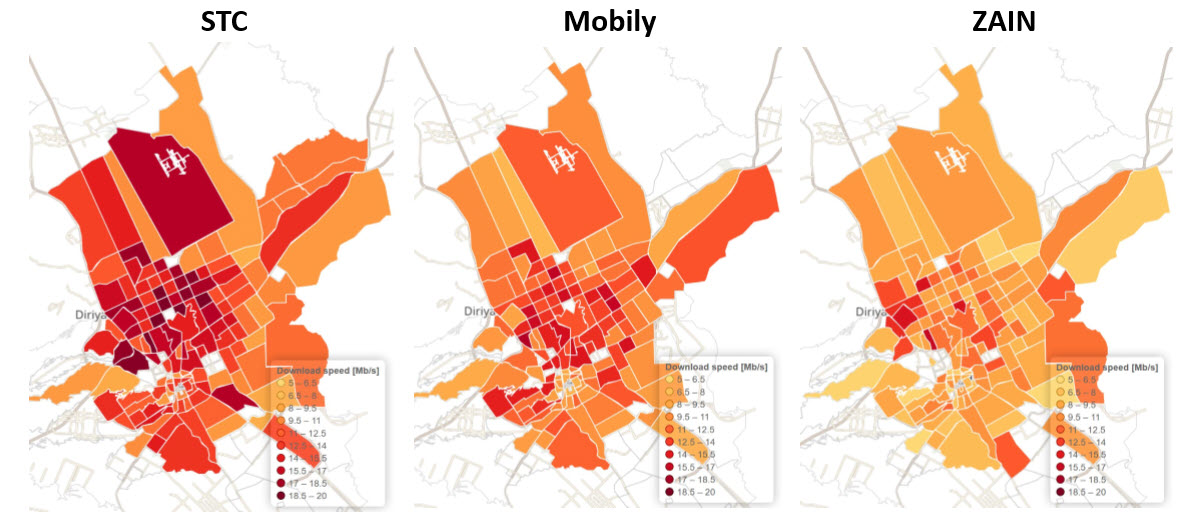
By adding the download speed data to our districts map of Riyadh we can clearly see that STC provided the fastest download speeds followed by Mobily and finally Zain. The maps also show a consistent difference in speeds from district to district. Districts that are the fastest or slowest for one provider tend to be the fastest or slowest for the others even though their actual speeds may vary.

riyadh_mobile_speeds

map_scale_1


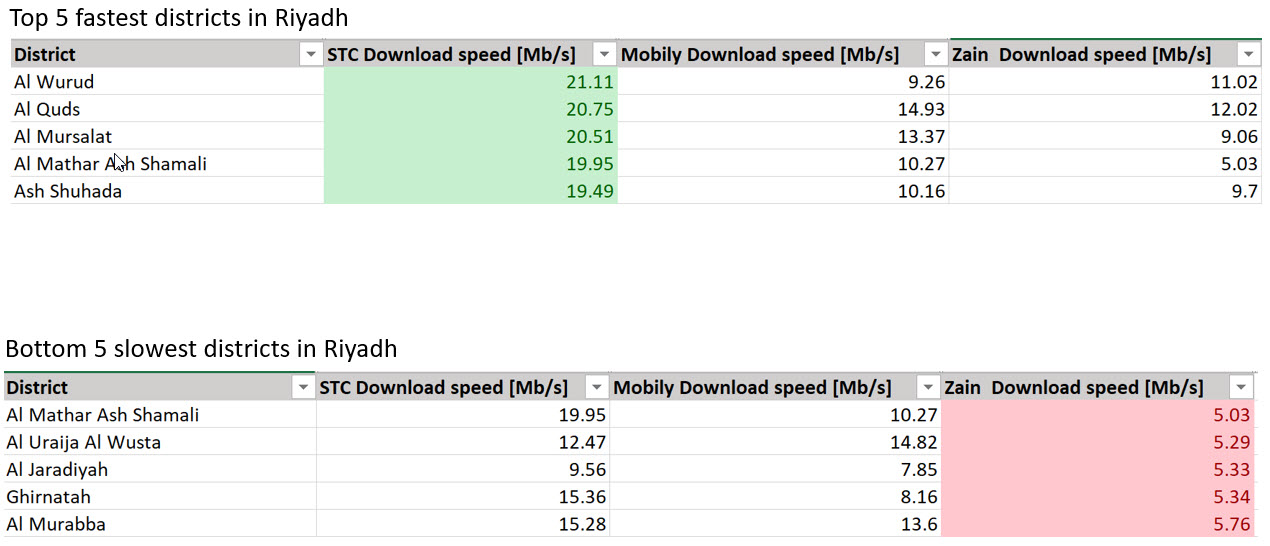
The following table illustrates the fastest and slowest districts in Riyadh based on the average mobile download speeds. The speeds highlighted in green represent the 5 fastest speeds by provider and the red speeds are the 5 slowest by provider. It is clear from this table and the maps above that STC are getting the fastest mobile speed test results and Zain the slowest.


riyadh_districts

Conclusion

Riyadh has excellent 4G coverage provided by STC, Mobily, Zain and other mobile operators. The MCIT (Ministry of Communications and Information Technology) plan for rolling out fibre across Riyadh is well-established and their progress map is accurate.

All 3 companies are providing a good service with STC having more coverage and faster speeds. Our report has highlighted some areas of Riyadh that could need some improvement in service and others that are doing very well. This may inform future plans for infrastructure changes.

This is a good foundation that should ensure Riyadh will be well-placed to continue to take advantage of improvements in technology such as 5G. This will ensure that businesses and residential users can continue to enjoy all the benefits that these advances bring.

logo-smallInterested in more detailed information on the Internet quality and coverage in Middle East and beyond?

Contact us for more information

What happens to mobile network on the biggest event of the year? Not what you would expect!

Hajj 2018: 2 Million visitors over 6 days

Between 19th and 24th August 2018 over 2 million visitors arrived in Mecca for Hajj. This annual pilgrimage to the holiest city for Muslims is associated with the Prophet Mohammed who is said to have lead his followers there before consecrating it to Allah. It is considered a religious duty for all adult worshippers who are able to undertake this pilgrimage at least once in their lives. This number of visitors more than doubles the usual 1.5 million population of Mecca causing almost unimaginable challenges to the city’s infrastructure. In this article we discuss just one of these challenges : mobile Internet speed and access. It is hard to imagine how the infrastructure could cope with the huge increase in demand.

Hajj 2017: Review

During Hajj in 2017 mobile data demand nearly doubled compared to 2016. Although an increase of 60-70% was anticipated the 100% jump was a surprise. This was attributed to the increase in popularity of YouTube and Snapchat. Despite the increased demand, 99% of calls were successful and 23,000 Terabytes of data were consumed. According to the UN Sustainable Development Goals report published in ITU News from September 2017 this was thanks to the deployment of 3700 ICT specialists and 13,000 2G, 3G and 4G mobile base stations in all Hajj cities. The report does not specify which Telcos were involved. Source: ITU News.

Hajj 2018: The Kingdom’s Initiative to Maximise Mobile Communication During Hajj

King Salman bin Abdulaziz and the Crown Prince Mohammed bin Salman issued a directive “to do everything possible to make it easy for pilgrims to perform the rituals of Hajj”. The initiative’s objective is to allow pilgrims to communicate with their families and enable them to access the digital services available in the Smart Hajj initiative, so that they can enhance their experience and allow them to take advantage of enhanced communication services, as per a release issued by the authorities.

In particular, a number of packages provided by some of the main mobile operators offered their customers 1 Gb for 48 hours. Source: https://www.tahawultech.com

The Challenges

The challenge of providing adequate mobile services during a large event is not simply trying to maintain the current service levels. It is also about balancing the needs of the visitors with key service areas that are essential during the event. Consideration must be given to protecting the critical infrastructure of the region to enable it to respond to serious incidents. One way this can be achieved is to ensure there is resilience and redundancy built in to the infrastructure. Consultation with interested parties is essential to ensure that the steps agreed will meet the essential needs of all concerned. A thorough risk and threat assessment will identify where the effort is required.

It is a balance between being good hosts to the visitors and ensuring a continuity of services for the locals. Short term measures and agreements will be a great help in achieving this balance and the generous provision of 1Gb over 48 hours in Mecca is one such example. This may be the headline initiative but it is clear that much more has been done in many other areas to ensure a successful Hajj.

Telco Infrastructure in Mecca

Mecca has an excellent 4G network covered by a number of major operators. Building on the improvements made for Hajj 2017 this has allowed them to improve the average download speed by 83% between 2017 and 2018. They will continue to improve as they roll out 5G and it is expected that this will be further improved as part of Saudi Vision 2030.

Saudi Telecom Company (STC) has been at the forefront of this with investment in FDD and TDD LTE spectrum assets. The rewards of this investment can be seen in our results which show STC outperform the other providers in our research.

Zain have also been investing in technologies that allow them to extract the best out of their infrastructure. They are also preparing for 5G rollout.

Mobily has partnered with Ericsson to deliver 4×4 MIMO and as with STC and Zain they are preparing a 5G rollout.

As the Telcos continue to improve installed and available capacity so the Internet speeds can be expected to increase.

Speedchecker measurement methodology

Ahead of Hajj, Speedchecker started data collection to gather as many data points in Mecca as possible before / during / after the event. The crowd sourced data samples were collected in the field using mobile phones carried by the pilgrims to Mecca. Measurements were run on mobile networks of the top providers using Android and iOS devices. The measurements were made towards local CDN PoP based in Riyadh. The recorded results are a good proxy for the internet quality users were experiencing in Mecca on their mobile devices. During the 15 days the data collection took place, Speedchecker received over 100,000 data samples and the included stats and analysis are based on this dataset.

Hajj 2018: The Results

The results show that not only did Mecca cope with the extra 2 million visitors they exceeded all expectations. It would be reasonable to expect that speeds would decline by up to 50% during Hajj when compared to the week before or the days after. However, the speed test result reveal that the steps taken in Mecca allowed visitors and locals to enjoy an increase in speed that was continued throughout the following days. Our analysis stops after the 26th August.

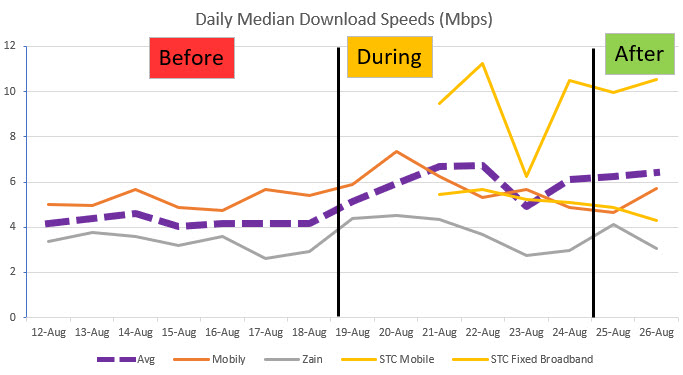
The chart shown below shows the median (middle value) of Mobily Mobile, Zain Mobile, STC Mobile and STC Fixed broadband. We only have STC data from 21st August (Hajj started on 19th) and we have separated the STC Mobile tests from the STC Fixed Broadband tests. There is an unexplained drop in speed for STC mobile on the 23rd August. We have included the STC Fixed Broadband to show that the problem only affected STC Mobile customers. Despite this 50% drop from STC the overall trend during Hajj was a gradual increase in download speed.

STC mobile download speeds are more than 50% faster than either Mobily or Zain and this shows that investment in infrastructure yields positive results and benefits to the end user.

mecca_by_day

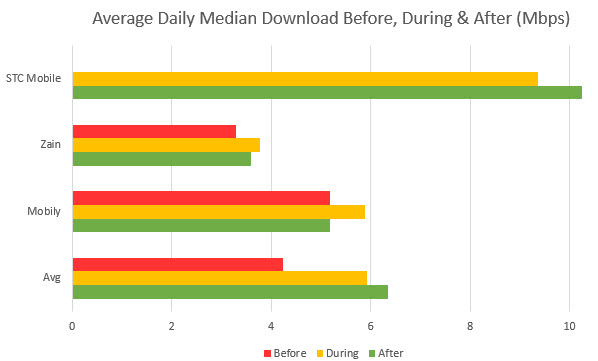
The following graph compares how the average daily median speeds of each of the providers changed before, during and after Hajj. The average shows a remarkable increase throughout Hajj and into the following days. Zain’s speeds after Hajj are faster than those from before while Mobily has returned to before Hajj speeds.

mecca_by_provider

Whatever improvements and changes were made to the Telco infrastructure during Mecca the results of the download speeds show that it was a huge success.

Internet speed map of Mecca

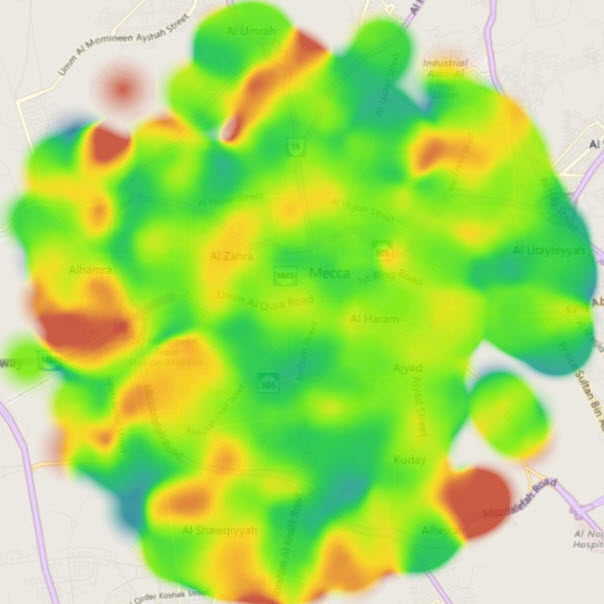
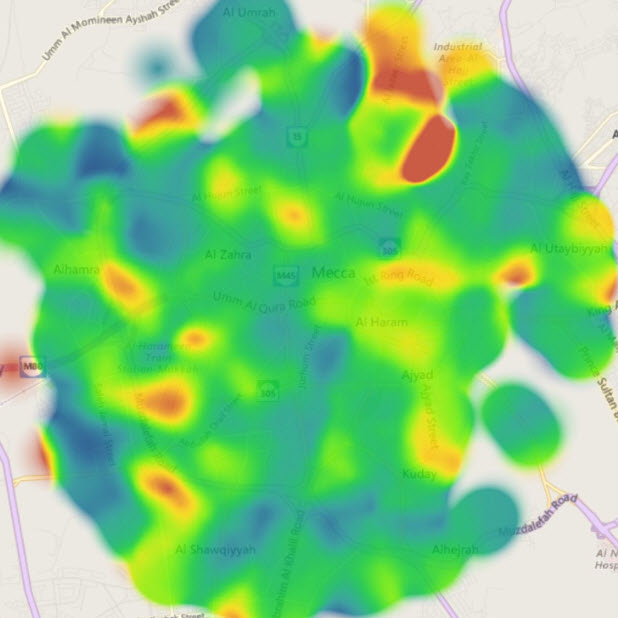
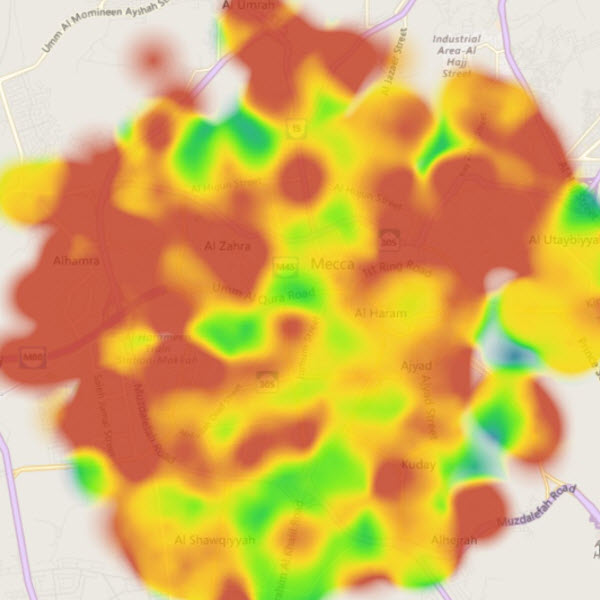
Using mobile device GPS data we were able to map internet speeds in Mecca to a high geographic precision. Collected data were normalized and color-coded so that the fastest areas are in red and slowest in dark blue. The outskirts of Mecca which are not colored are out of scope for this study.


Mobily

As can be observed the fastest areas for Mobily are not in the center which can be attributed to increased demand from higher concentration of people.

mobily_heatmap


Zain

The Zain speed map is slightly darker and corresponds with slightly slower internet speeds than Mobily. Yet the centre is faring quite well in comparison with Mobily.

zain_heatmap


STC

The STC internet speed map looks comparatively much better than Mobily and Zain and proves that internet speeds are well distributed across whole of Mecca.

stc_heatmap

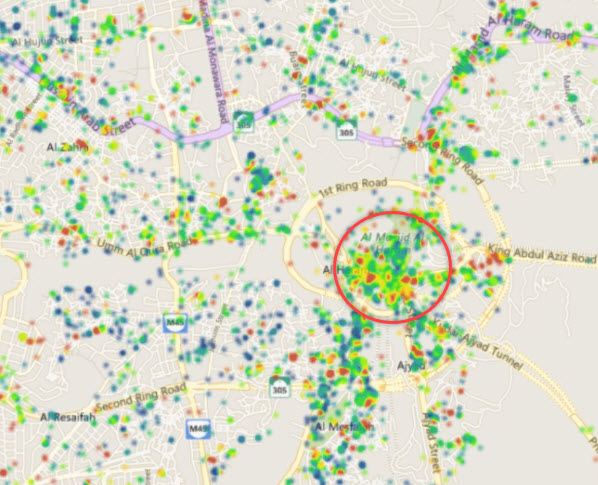
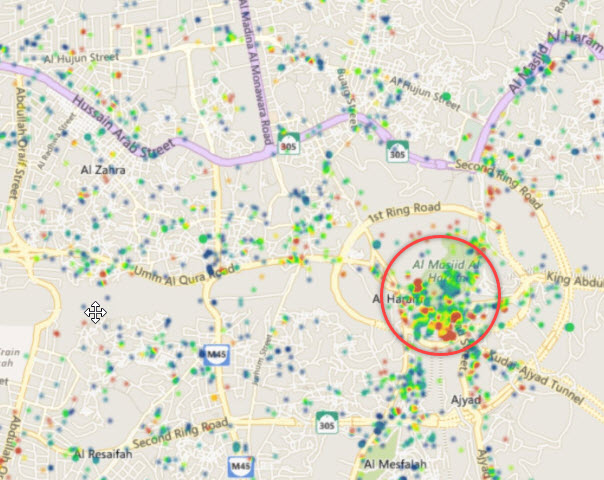
The internet quality around Great Mosque is better illustrated using more detailed heat map where you can see individual measurements (which are also color coded like on previous maps). The area around the mosque has very good speeds also for Zain, which indicates Zain did not underestimate the capacity needed in the center.

Mobily Zain
 mobily_circle  zain_circle

Conclusion

The 2 million pilgrims arriving in Mecca in 2018 provided a huge challenge to ensure that the quality of service that visitors and locals expect can be delivered and maintained. We have seen how the demand doubled between 2016 and 2017 and this increase was sure to continue in 2018.

The Saudi Arabia Initiative and the efforts and investments of the major mobile operators has ensured that the quality of the service has not only be sustained but improved. This improvement has continued at least for the few days after Hajj (we have no data beyond this). We don’t know how much of the improvement will be permanent but, with a similar commitment in 2019, we can be confident that Hajj will continue to be a Telco success.

Looking further forward we can see that the Saudi Vision 2030 has ambitious plans that should sustain this for the foreseeable future.

Speedchecker partners with DD-WRT to build world’s largest monitoring network

Speedchecker, a private company running large-scale software-based monitoring networks and DD-WRT, the most popular open-source router firmware, announce a partnership which will aim to build the world’s largest hardware probe monitoring network.


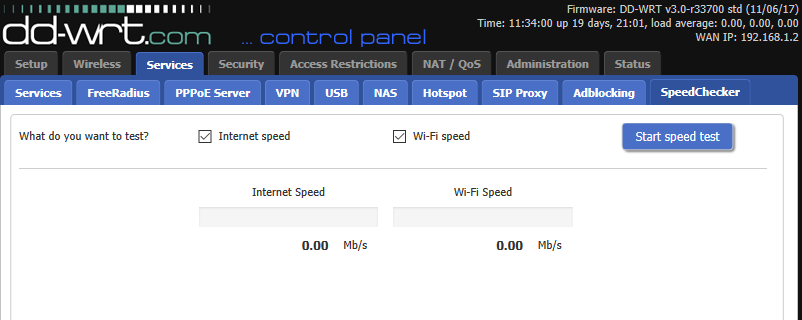
Under the terms of the partnership DD-WRT started including the Speedchecker Probe client within the DD-WRT firmware. DD-WRT users can opt-in to the Speedchecker network and get new features for their routers in exchange for providing bandwidth for Internet measurements.


Wi-Fi Speedchecker feature for DD-WRT
Image: Wi-Fi Speedchecker feature for DD-WRT


As Christian Scheele from the DD-WRT development team said:


“We are pleased to be part of this partnership to not only help fund the DD-WRT development but also be part of the project which enables Internet research be conducted on a large scale across many countries that are currently not represented in existing measurement networks”.


Since the soft-launch earlier this year over 2000 users of DD-WRT have already opted-in to the network, enabling Speedchecker to cover over 80 countries for its Internet measurements. Speedchecker offers access to its network to clients such as Microsoft and Oracle, as well as researchers in organizations such as LACNIC which publish Internet topology research.


CEO of Speedchecker Ltd, Janusz Jezowicz noted:


Historically, companies always had to make a choice of either running measurements from software probes with its wider coverage but lower accuracy, or rely on hardware probes which had limited coverage. With this partnership we are able to provide global coverage for hardware probes with low costs due to end-users running the tests on their own routers and not expensive custom hardware.


Brand new shiny and polished Internet measurement API

After a few months of hard work we are pleased to announce a new version of our Probe API. We decided to completely rewrite the API specification to apply all the things we have learned over the last few years without breaking API access for our existing user base. We don’t plan to sunset the old API version yet, but new clients are not able to sign up for the old version.

The new version is so much better; we have made following improvements:

Easy to use
Our API is well documented including a Quickstart guide which will get you up to speed quickly so you can start running your measurements.

Reliable
We have learned a lot of lessons over the years about how to make the API more scalable . We are pleased to say the new API already supports millions of measurements running every day!

Multi-platform
As part of new API release we are offering access to our Android probes to all of our users. API users can leverage increased coverage by testing on all available platforms, or specifically target mobile probes using Platform source targeting. We will soon have an announcement about hardware probes which will be supported in the same way, without the need for code changes.

Great level of support
Being a small company, we have always taken personal care of each client and made sure our support team provides expert advice on internet performance measurements to assist clients in fulfilling their goals.

Transparent pricing
Our API access starts from 49 EUR per month.
Please check our pricing here.

API Features

On top of those improvements mentioned above the API features also got an upgrade. Based on feedback we got from our users we have improved the API methods to include:

Improved probe targeting

Our new API offers many more options on how to select probes for measurements. Our users can select probes by location (e.g. City / Country / Lat and Long coordinates), network (Network name, ASN or IP prefix) and more.

More information about probes
Using ProbeInfo properties API users can specify what information about the probe is useful for them to return with the measurement results. We have added new properties such as DNS Resolver IP, Screen size (useful for page load tests), User connection type and more.

Extended tests and new metrics
Our API supports existing measurements such as Ping, DNS, Traceroute, HTTP, Webpage load. We have also added a new measurement type – video streaming test.

Further changes to the API endpoints:

Ping
We added an option to run TCP ping.

DNS DIG
DIG command now responds with full DNS query information .

HTTP
We now have available metrics such as TTFB, TotalLatency, DownloadedBytes, TCP connect time.
HTTP GET measurement can also return full HTTP Headers and Body. This can be very useful for many scenarios such as finding out which CDN POPs are being accessed, CDN cache HIT/MISS analysis, keyword monitoring in the HTTP response. The possibilities are endless!

Webpage load
We offer all the web performance metrics you would expect and we have added a couple more: such as the number of requests the page has loaded as well as full HAR file. HAR file is very useful in getting a complete picture of the pageload performance and allows you to construct a waterfall model which we use in our CloudPerf product.

Free trial

We hope all the improvements we have made will encourage you to sign up for our 7-day FREE trial.

How to pick the best server based on Latency and Throughput

Choosing an optimal server location isn’t necessarily an easy task. Managing costs and selecting an appropriately sized hosting package is just one part of the deal. As much or more important than server capacity, is finding out how your services behave from your client’s perspective. Whether it is for choosing among different hosting providers or deciding in which location it is better to deploy your server, you need to measure latency and throughput. Having an insight into these two metrics can improve your service and result in cost-effective solutions.

In this article, we take a look into these two basic aspects of connectivity: latency and throughput. We discuss their behavior and show you how to use CloudPerf to compare and choose an optimal server for deploying a web page.

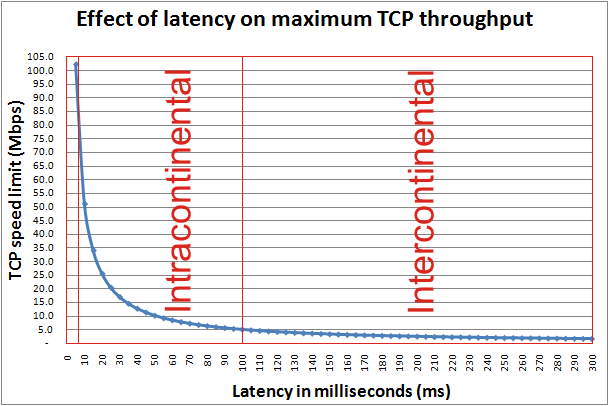
As we know, TCP performance is naturally limited by Latency. As for this, the first aspect we have to look into a server’s performance is Latency, then focus on throughput. No matter how big a link may be, if your users experience a high latency, it is not possible for them to achieve high performance. The next graph, shows the interdependency of Thoughput vs. Latency.

tcp-speed-limit

Here we can observe an inverse exponential curve, which in practical terms, it means that especially in the 1-30ms range, every millisecond of latency will have a heavy effect on the maximum achievable performance. With this in mind, we can picture very clearly the intuitive notion of choosing a server as close as possible to your clients, but still take into account even the smallest differences in latency.

Let’s say we have an account with a cloud provider and we want to deploy a service for European users. We can take Digital Ocean as an example, where we can deploy a VM in Amsterdam, London or Frankfurt, among others. We deploy the same test service on each of those locations. Then we set up a Static Object measurement for them in CloudPerf pointing to a 100KB test file and a Ping measurement to each server. We make sure to select the countries of our interest and start measuring. We choose to measure for one hour, one measurement per minute.

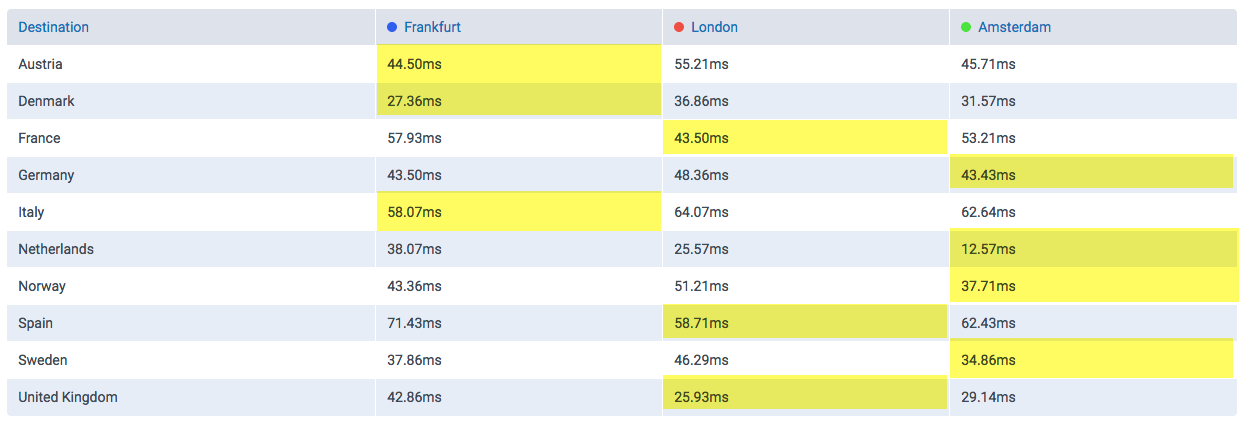
The following table shows the latencies obtained from each location to each of the three servers. The lowest latencies have been highlighted in yellow.

latency-table

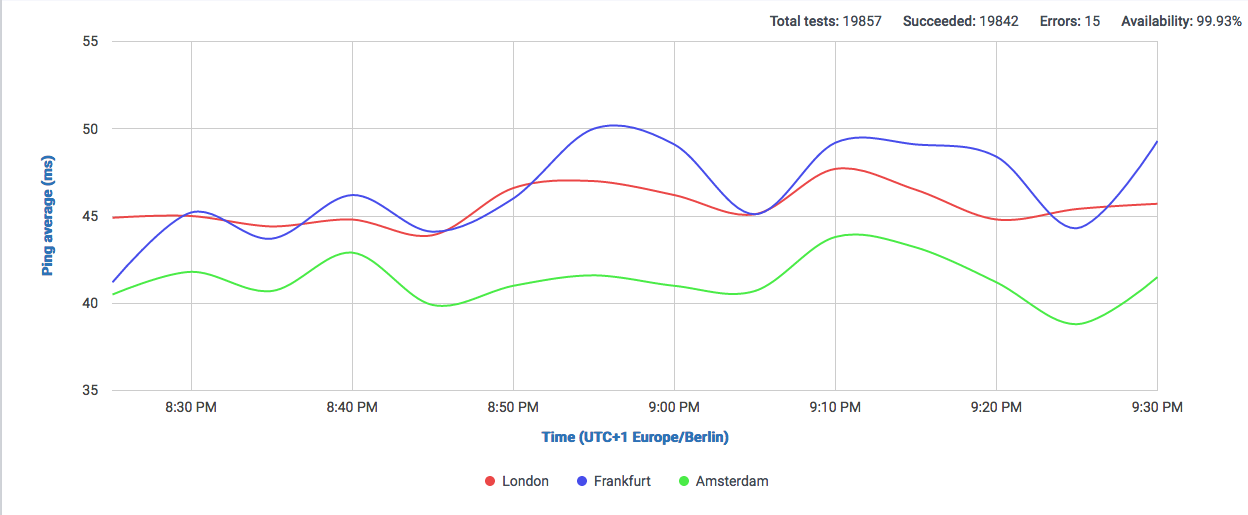
We can observe that depending on the countries we are serving to, we can expect a very different result for each server. But focusing on all countries altogether, we can say that Amsterdam and Frankfurt have the lowest latencies in general. Let’s confirm that with the graph:

latency-graph

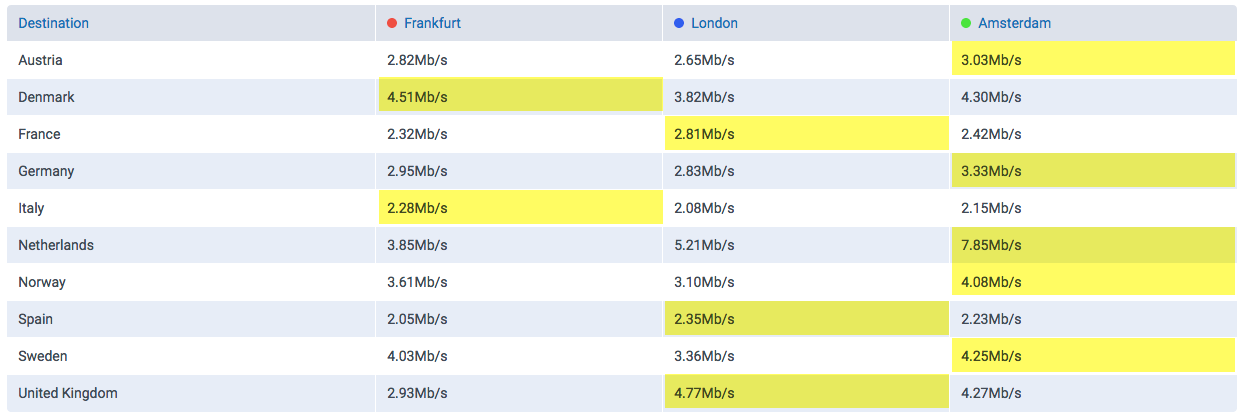
This is one for latency, but what about throughput? Given similar enough latencies, like in this case, the effective TCP Throughput may be affected by other factors, so we take a look at the download speeds achieved for each server, now the highest Throughput has been highlighted in yellow.

throughput-table

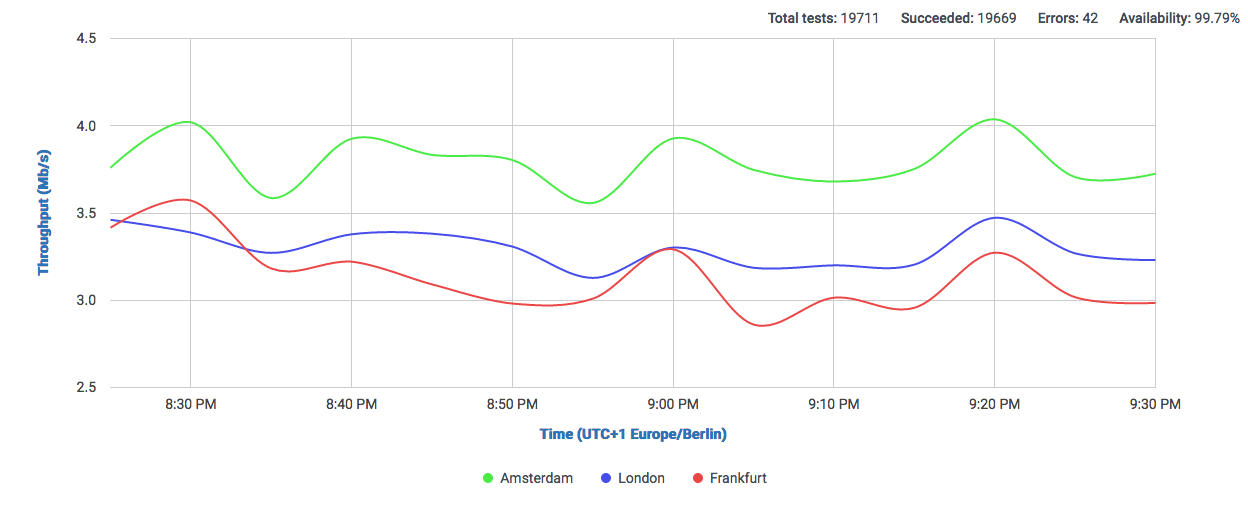
Here we can clearly observe that clients from Austria and Germany, which showed ping values favorable to the Frankfurt server, actually show a higher throughput when serving from Amsterdam. Let’s take a look a the graph:

throughput-graph

No we have confirmed that our Amsterdam server will show the best performance. Of course results will vary depending on which countries we focus on, but we can clearly see a general advantage of using Amsterdam as a single location for this selection of countries.

From friend to foe: Lessons learned from Google becoming our competitor

Every startup is rightly afraid of a new competition, especially if it comes from Internet giants like Google. The stories of how Google enters the market and dominates it in a few years are not new (such as mobile OS and Android, or recently browser wars with Chrome) . In some cases Google gets a slap on the wrist or occasional $2.7 billion fine . Nevertheless, the situation is not likely to improve and Google’s dominance in search will grow into other areas, if Google decides to compete there.

This blog post hopes to give an insight into the impact of prioritizing Google funded initiative over existing players in the market, using the real numbers from specifically our small business (which I am not sure is still right to call a startup after 10 years) 😊

But before I do so, let me give you a super quick overview of what my company – Speedchecker does – we provide easy to use and accurate speed test of your internet connection. After almost 10 years we have done over 300 million tests and provided speed test technology for many other companies.


Launching Google speed test

The story begins about a year ago when Google launched their own speed test featured directly in search results in USA and followed by other English speaking markets. We knew that the UK launch would happen eventually but we did not know when.

Luckily for us Google picked an open-data solution for running their speed test , noble M-Lab. M-Lab was founded by internet visionaries such as Vint Cerf and is funded by consortium of companies including Google. This choice enabled us to analyze the rollout and provided real numbers for this blog post.

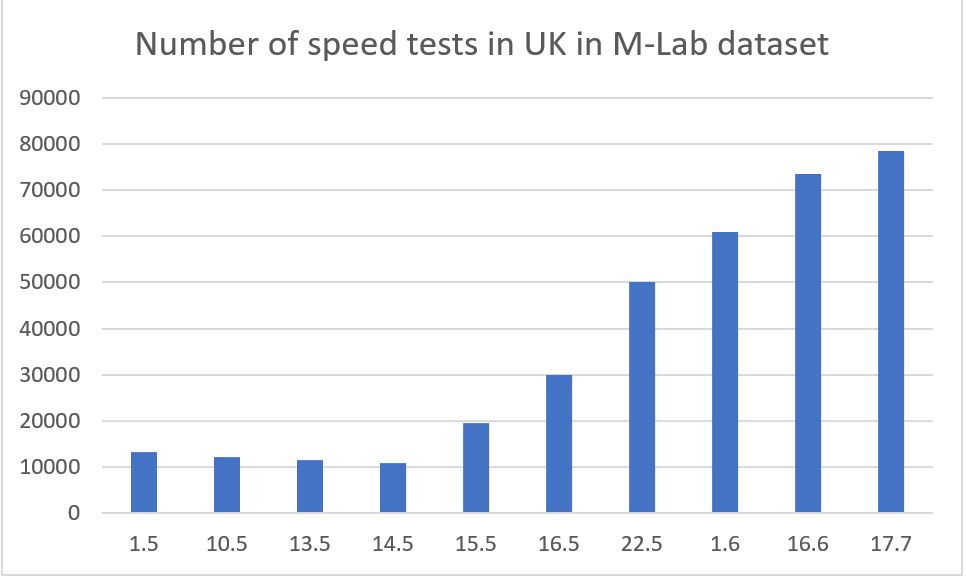
M-Lab speed test data is available to download for everyone through Google Cloud (of course). By analyzing volumes of data each day, we could produce following chart:


chart-google-test


(Number of speed tests from UK in M-Lab dataset on random days in May, June and July 2017)

As we can see, Google started  the rollout on the 15th of May. We can also observe that Google did not do an immediate rollout across all the UK users but over the course of several days, the feature was introduced to more and more users in the search results.


Impact on visitor numbers to our website

Here is how the search results look like in the UK for one of our main keywords:
broadband speed test Google Search


As we can see Google speed test occupies significant space on the 1st page and pushes all results below.

Here is the chart plotting user visits from Google (and Bing for comparison) before and after the Google speed test release. We can observe the drop in visitors begins after Google launches the speed test.


google-vs-bing (1)


To better illustrate that the drop is because of ranking change and not seasonal factors, here is zoomed in data from Bing which does not show any meaningful change before/after 15th of May when Google launched.


bing (1)


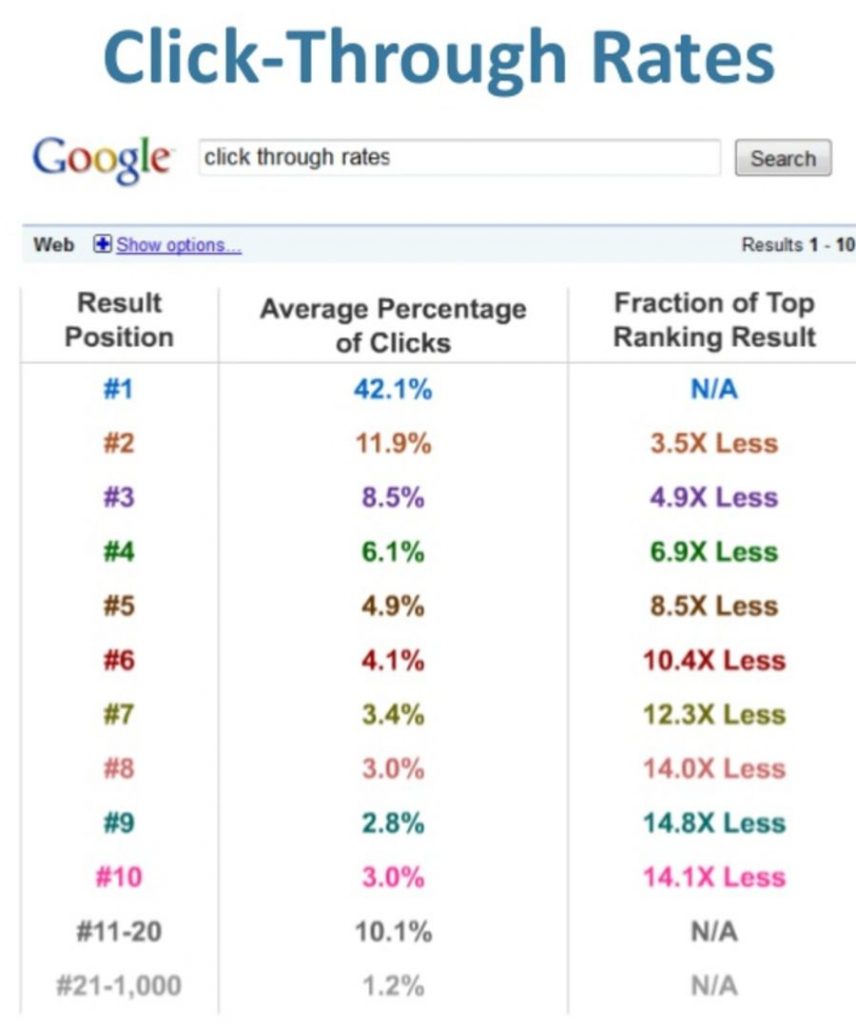
Looking at the average drops we can estimate the loss of about 5000 visits per day from 25000 Google visits. Overall that is about 20% traffic loss from being moved from position 1 to 2.

Comparing to industry standard data e.g. by RankScience, 20% drop is quite a good result, it could be worse.


rankscience


From M-Lab dataset we can also extract quite interesting insights as it contains user IP address as well. If we cross-reference user IPs seen in M-Lab data with our internal data, we can see about 5% of users use both services. We can only speculate whether it’s a good result or not, definitely for the user it is useful to get information from 2 different sources and decide what is more relevant.

Conclusion

From our perspective we are quite happy the Google threat is not as serious as we originally thought. Loosing 10% of our overall traffic (and 20% of Google’s) will have impact on our bottom line but we will survive. Luckily, we provide other features that user’s appreciate such as mobile apps, storing results, mapping, comparisons and more. This I believe contributed heavily to such a small drop. I have no doubt many users will favor convenience of 1 click to get result in search results directly than going to 3rd party site such as ours. Unfortunately, there is nothing we can do to compete with that and stay in business at the same time.

With Google favoring their own speedtest, M-Lab datasets are growing at a rate of almost 1 million results per day and will achieve to serve as many customers in less than a year – something  we have achieved in the last 10 years. That is the power of Google search dominance.

Are ISPs still throttling Netflix?


In the recent past we have seen a massive development of online streaming services, where Netflix is one of the leading brands in this new market. Netflix has built its own CDN (Netflix Open Connect) to support its worldwide expansion. This resulted in a rapid growth of bandwidth consumption from a considerable number of users, intensifying year after year together with Netflix’s popularity. Netflix has undergone a massive structural transformation in the way it delivers content. Parting from a monolithic application design with some external CDN support to building their own CDN around the world. Currently Netflix Open Connect has 233 server locations in all 6 continents. Their endpoints are primarily located among IXPs and within some ISPs as well. A model which reminds us of Google Global Cache, by installing cachés close to the last mile to deliver specific services.

ISPs have reacted differently across the globe, resulting in some heated discussions about traffic shaping, throttling and service differentiation from ISPs, which rose considerable criticism from defenders of net neutrality and consumers alike. Two years after our previous insight into this topic, we decided to find out what is happening today, if any ISPs are showing signs of throttling Netflix. We found that the situation has improved noticeably.

We setup an experiment which runs from thousands of Speedchecker probes around the world Netflix’s SpeedTest (fast.com) and right after that our own SpeedTest using Akamai endpoints. We compared the results of both tests using our SpeedTest with Akamai as reference and found out which ISPs show noticeable differences when connecting to Netflix. Due to Netflix’s high bandwith consumption and rapidly growing popularity, adapting to such changes might pose a challenge for some ISPs.

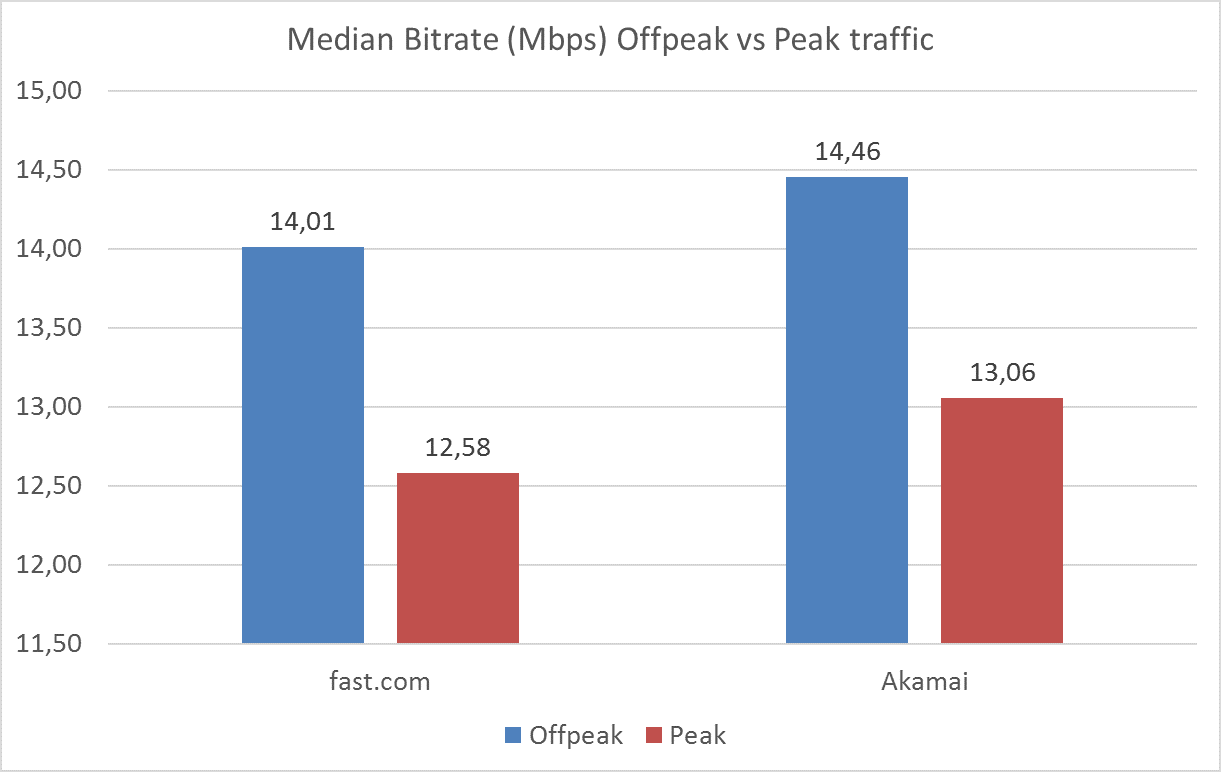
After running the experiment for 24 hours, we found that the performance differences between Fast.com and our reference endpoints in Akamai are equivalent, which fortunately tells us that the general rule seems to be not to throttle Netflix.

peak vs offpeak_

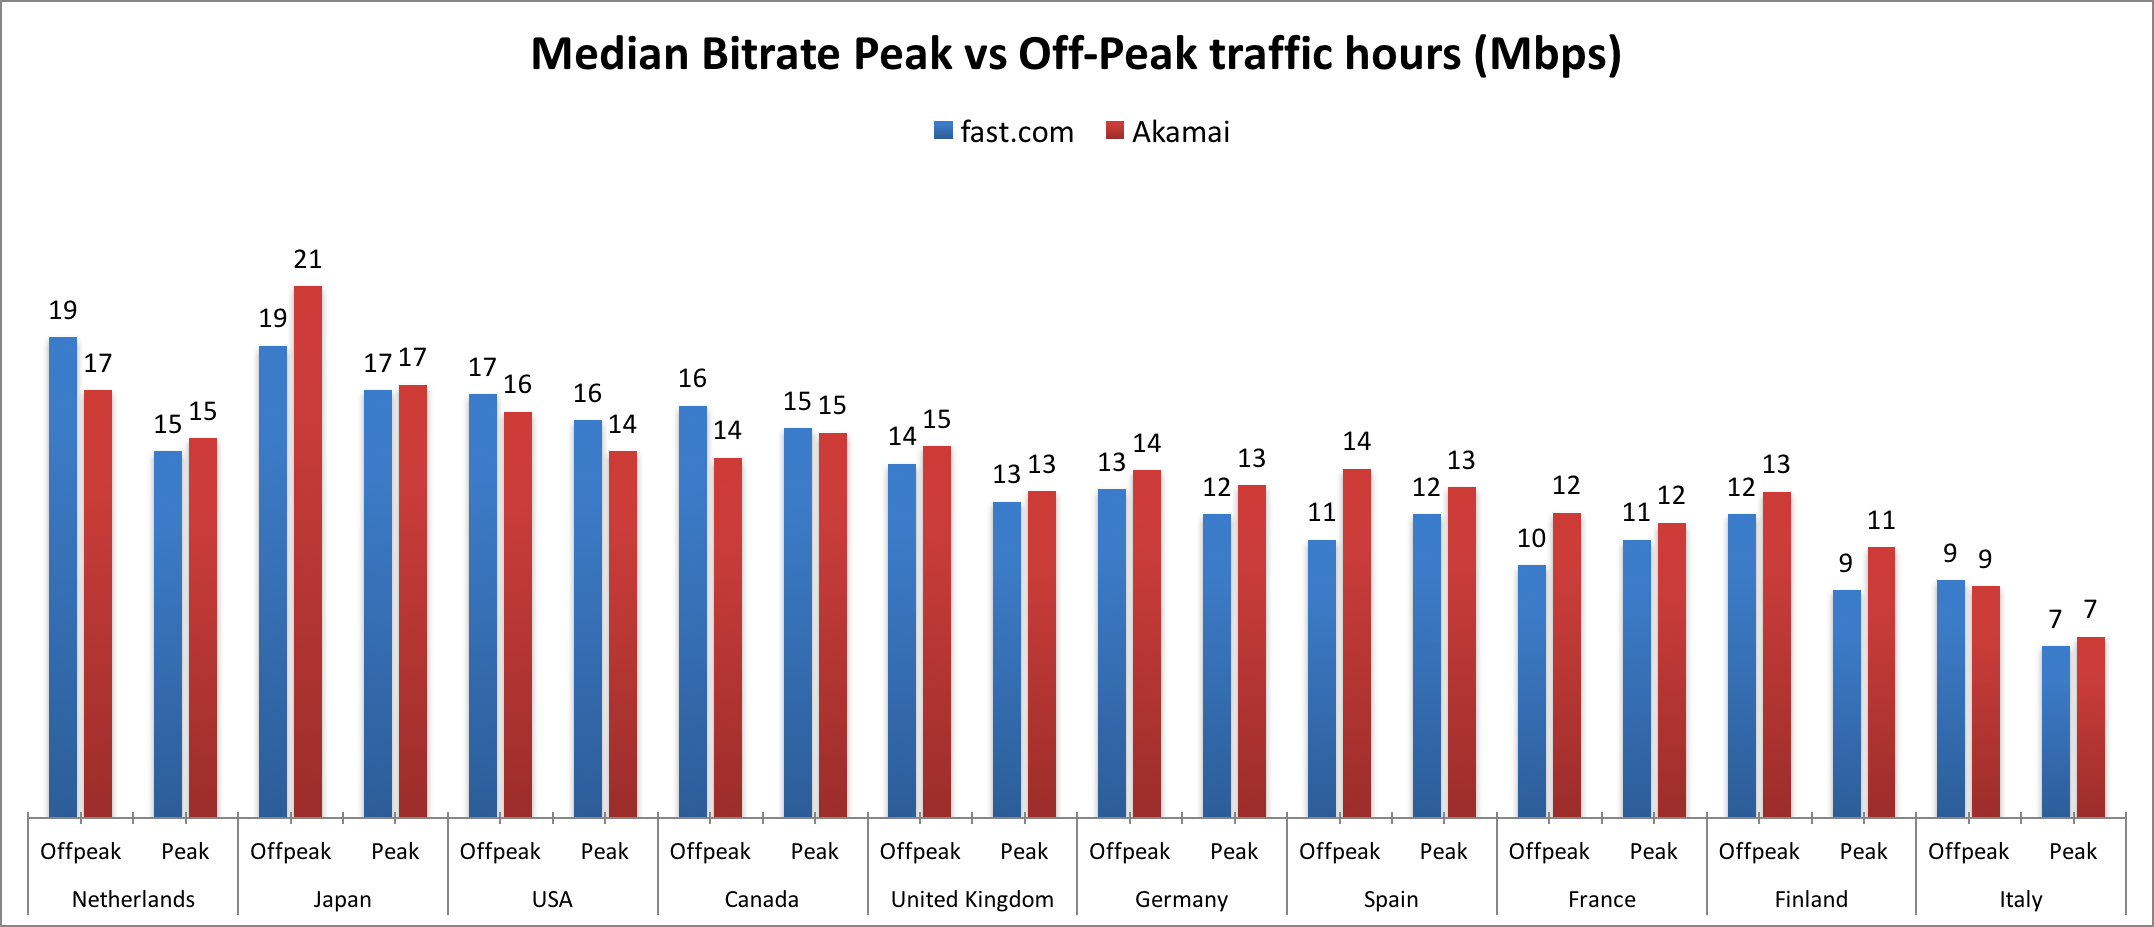
We can also observe that the situation still changes notably between countries, with Italy showing the worst performance among the countries where our measurements ran.

Countries-peakVsOffpeak

In the following table, we can see the ISPs in which we measured the top 35 highest median speeds.

[embeddoc url=”http://blog.speedchecker.xyz/wp-content/uploads/2016/09/ISPs-1.xlsx” download=”no” viewer=”microsoft”]

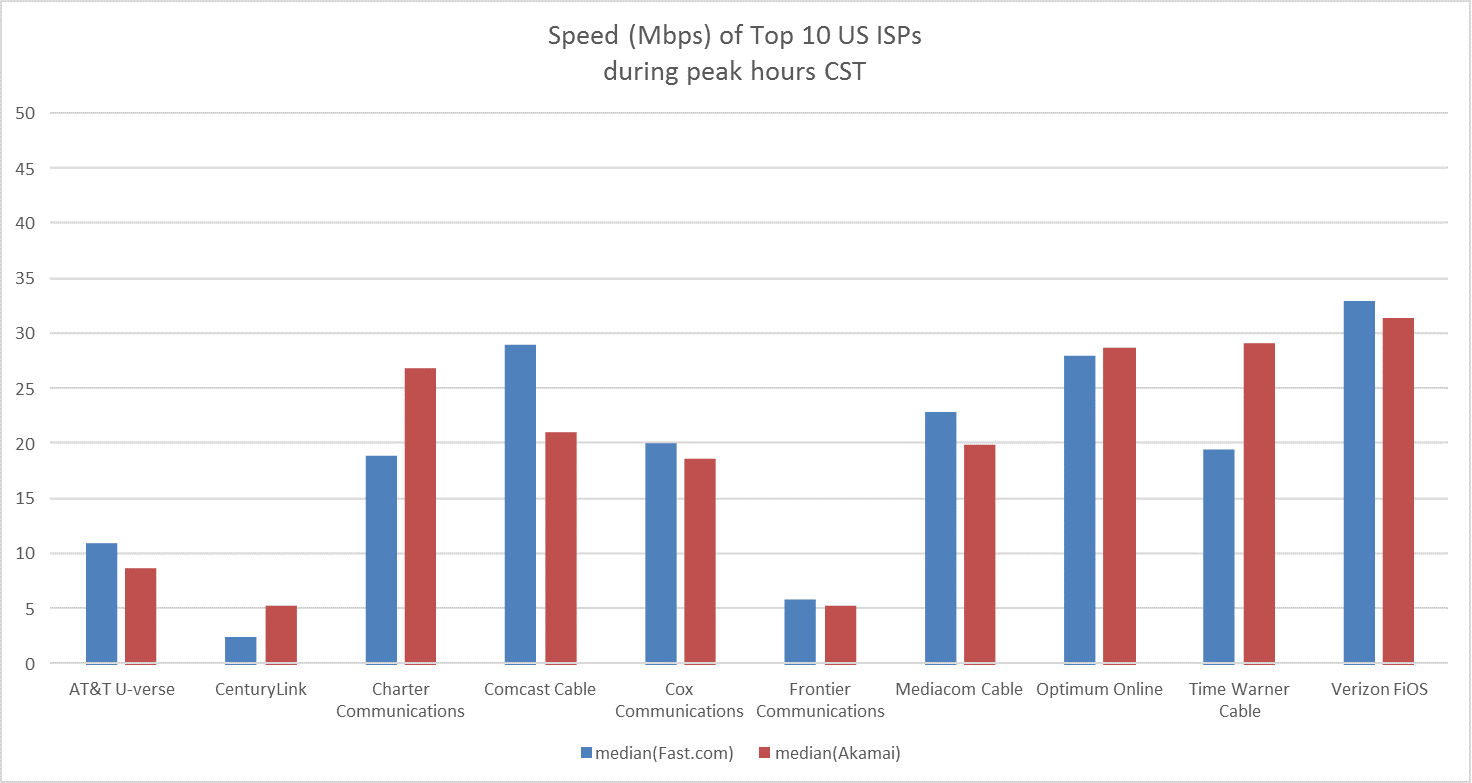
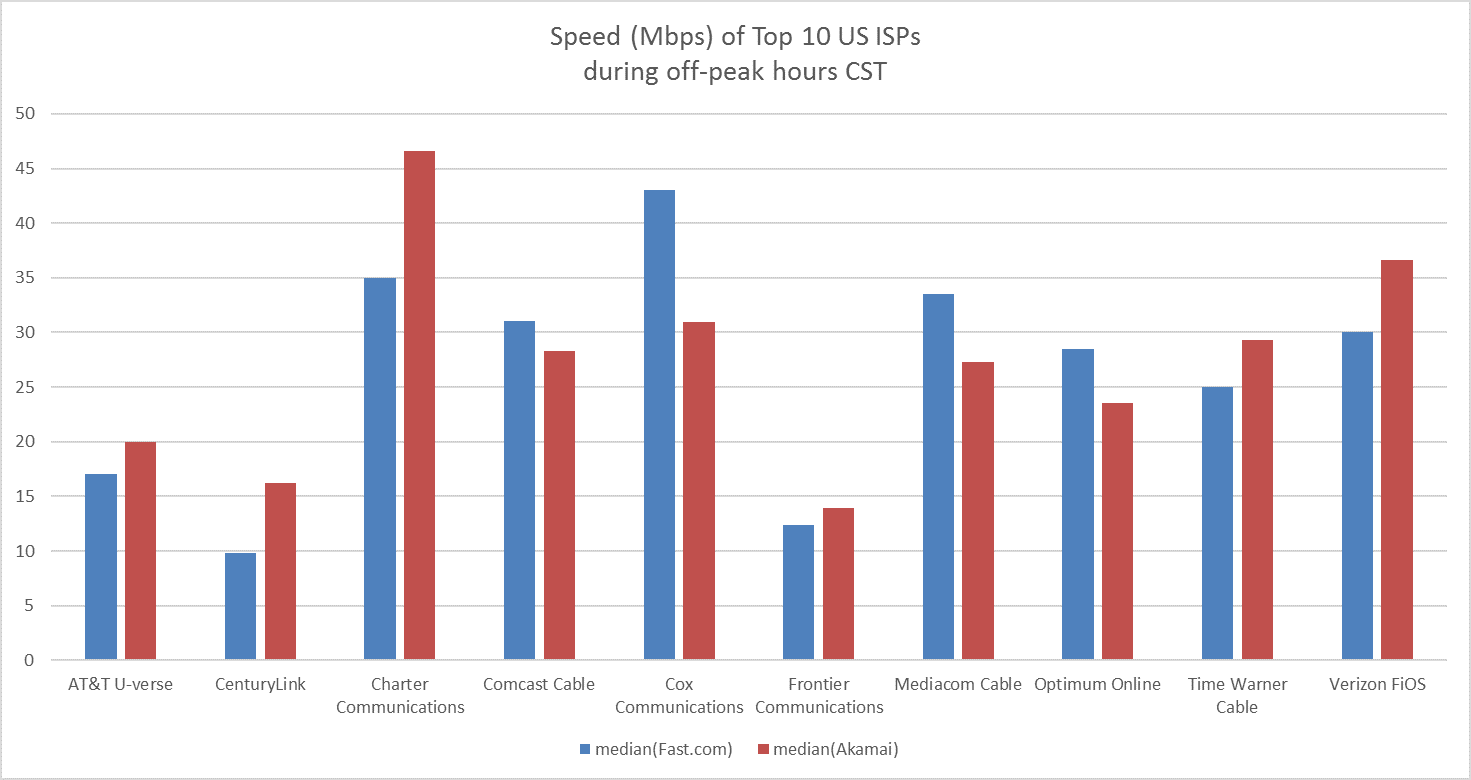
After investigating ISPs in the USA only, we we able to rank their top 10 providers as follows comparing off-peak and peak traffic hours.

us-peak2 us-offpeak2

We couldn’t detect further major ISPs showing signs of Netflix throttling in the countries we studied. In the cases of CenturyLink, Charter Communications and possibly Time Warner Cable, we can observe a clear disadvantage of Netflix during peak hours.

In conclusion, we have seen the situation of Netflix evolve in positive terms for the consumer. We can see from our test results that the global tendency is to respect net neutrality. There are still ISPs worldwide which haven’t joined Netflix OpenConnect CDN yet and therefore they cannot profit from its traffic delivery benefits. Others simply slow down altogether during peak hours which reveals difficulties at coping with high traffic demand. So far this year, Netflix global launch seems to have gone peacefully and without any major incidents. The market has made its share of pressure to the industry, pushing them to develop high performance infrastructure for the end consumer, while clearing the path for other applications high in bandwidth consumption to enter the market with lower technical and legal barriers.

Fill out my online form.


Speedchecker @ IETF 96


This year the IETF meeting in its 96th edition took place in the vibrating city of Berlin. We didn’t want to miss out on this important gathering and decided to contribute to one of their workshops on network measurement: nmrg.


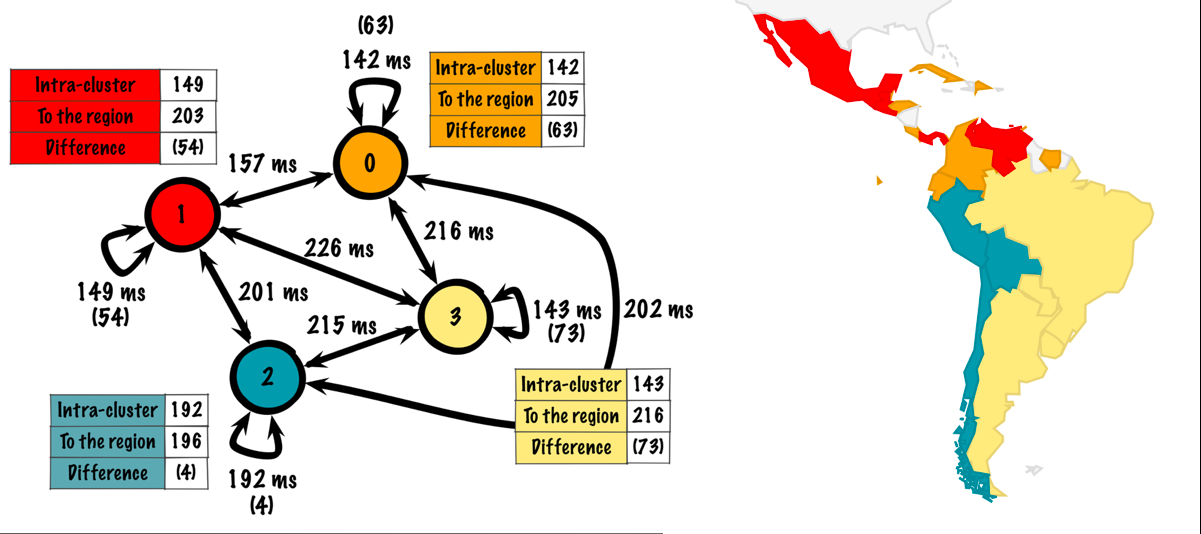
We presented a study that was made in cooperation with LACNIC Labs, where the Latin America and Caribbean region was measured using Speedchecker ProbeAPI during one year, making possible to map the region in terms of connectivity. This allowed us to identify clusters of countries that were better connected between them than to the rest of the region. A definition for connectivity had to be defined in such a way that permitted to draw interesting and useful conclusions about the situation in the LAC region.


Screen Shot 2016-07-21 at 12.10.13


The video of our presentation at IETF96 can be found here, our presentation starts at minute 43:00. The original blog post by Agustín Formoso from LACNIC Labs can be found here.

The study was received with high interest by both the chairs and audience at the workshop, spawning interesting discussions during and after the session. We are happy to be able to participate and discuss our measurement experiences with the IETF/IRTF community. We collected valuable suggestions and comments which will surely help us point not only our measurement techniques in the right direction, but also develop our products and regional presence in a way that favors coverage and scientific precision.

The IETF 96 meeting has been a very nice experience, allowing us to get in touch and meet personally important actors of this worldwide community as well as keeping ourselves up to date with relevant decisions, norms and standards that are currently being discussed.

Announcing new Feature: Page-Load Waterfall Analysis

Here at Speedchecker, we are aware of our customer’s requirements and we strive hard to build our products not only robustly and precisely, but also expand on features which will help everybody to diagnose their sites performance in greater detail, while at the same time , retaining that ease of use and clarity our customers love. Today we proudly announce the introduction of a new feature in CloudPerf: a detailed view of all your measurements. This feature is especially useful for frontend developers, who need to examine if the webpage loading time is not impacted too much by including slow external resources such as 3rd party tracking scripts or assets.


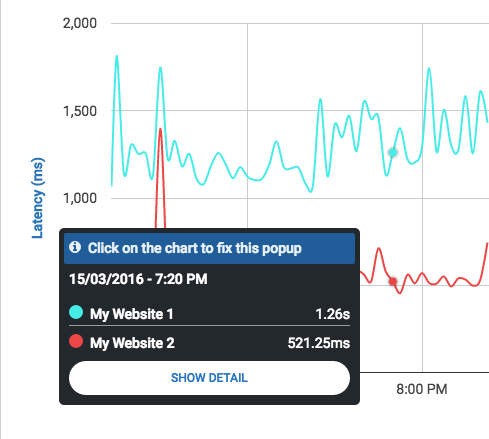
Inside your Benchmark’s results page, just move the mouse pointer along the graph  and click once in the position you would like to take a deeper look. The pop-up windows will stay after your click and you can go inside the detailed view by clicking “Show Detail”.

Screen Shot 2016-06-22 at 16.57.44

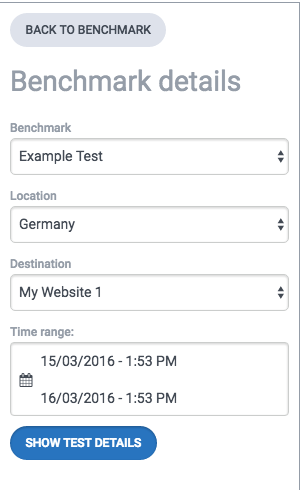
In this view you can see a panel on the left side, where you can choose the benchmark where you would like to take a closer look, the country of the measurements, destination website and the time range for which the results will be shown.

Screen Shot 2016-06-22 at 17.26.12
On the top you can see a timeline where after selecting the time-range you can choose with precision the time of the day you want to take a look into. Directly underneath the list of measurements made at that time will appear, showing the details of every single one of them.
Screen Shot 2016-06-22 at 17.26.22


If you are running a Page-Load Test, be sure to check the box “Collect resource timing data” in its configuration before running it. If you did so, using this new feature will be enable you to take a look using a very cool and useful Waterfall Chart, which will show you the loading times of every resource of the site you are measuring, for every single measurement in the time-range you selected. This way you can follow the behaviour of your services in detail over time.
waterfall
I hope you enjoy this new addition to CloudPerf and overall we expect it helps you to gain a greater insight into monitoring your resources.

Sign up now!