Which are the best-connected clouds in the Middle East?

Cloud expansion in the Middle East

  • Forecasts for 2022 reveal that end-user cloud speMiddle east mapnding might reach $5.7B this year alone, by 2027 it should reach an estimated $9.8B
  • In the last four years, companies such as Amazon, Microsoft, Oracle and Huawei have launched 9 cloud regions
  • Those new data centres enable low latency access to the hosted applications and content and help prevent data packet trips to Europe

Rapid cloud adoption by businesses and governments in the Middle East region is fuelling the expansion of new cloud regions. Forecasts for 2022 reveal that end-user cloud spending might reach $5.7B this year alone. In the last three years, companies such as Amazon, Microsoft, Oracle and others have launched multiple new data centres. Those new data centres enable low latency access to the hosted applications and content and help prevent data packet trips to Europe. This blog will uncover which cloud vendors are doing well in reducing the latency for the end users in this region and which still have the opportunities to improve their interconnection partnerships.

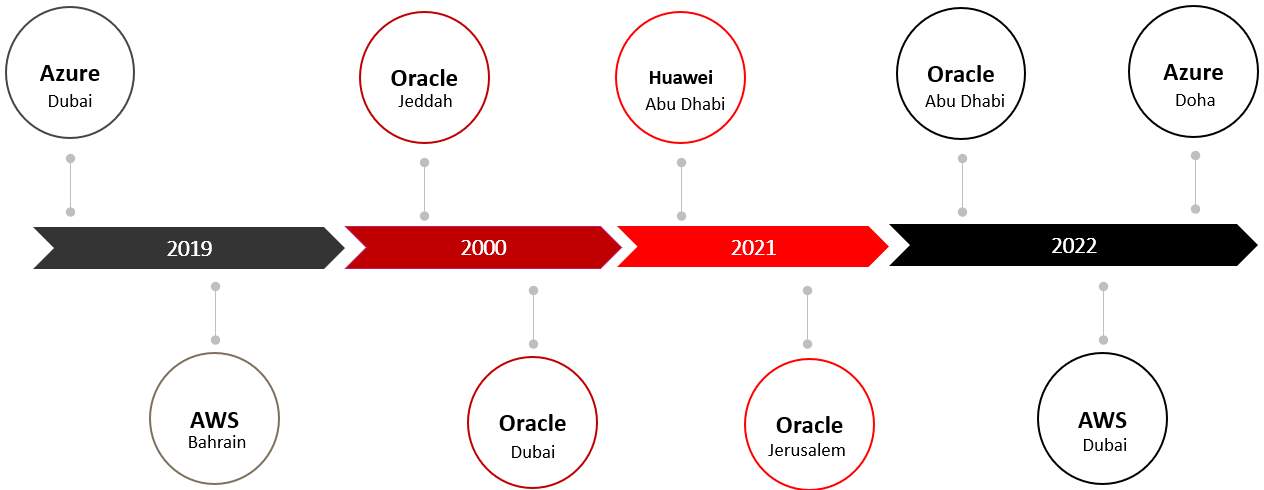
Cloud region launches

Since 2019 there have been 9 cloud region launches in the Middle East by AWS, Azure, Huawei and Oracle.

cloud region launches

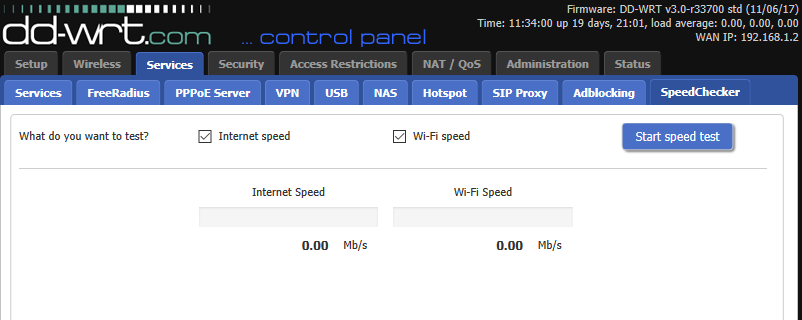
How SpeedChecker measures cloud latency

  • We leverage our expertise and existing testing solution in crowdsourcing quality of service for measuring cloud
  • End-to-end latency measurements from real users to the cloud
  • Tens of thousands of devices in the Middle East contributed to the measurements in this study
  • SpeedChecker deploys its measurement servers in each cloud region and instructs client test devices to test all cloud regions in sequence

The importance of local cloud regions

  • The interconnections between various networks in the Middle East are not sufficient
  • One cloud region cannot serve all countries in the region
  • Prior to 2019 applications and data hosted in European cloud servers resulted in  latencies of  >100ms
  • Latencies >100ms are unacceptable for many uses, especially for gaming

latency eu

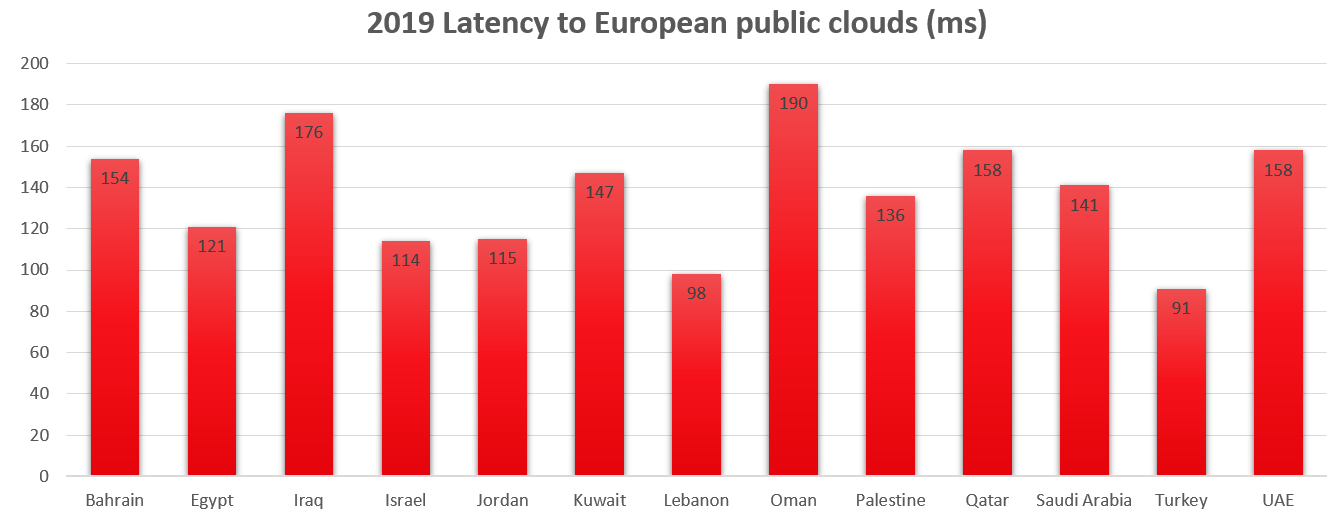
After UAE and Bahrain cloud regions launched (2019)

While UAE and Bahrain benefit from a substantial reduction in latency after the launch of cloud regions in 2019, other countries in the region see their latencies increase. Oman is the only exception.

latency

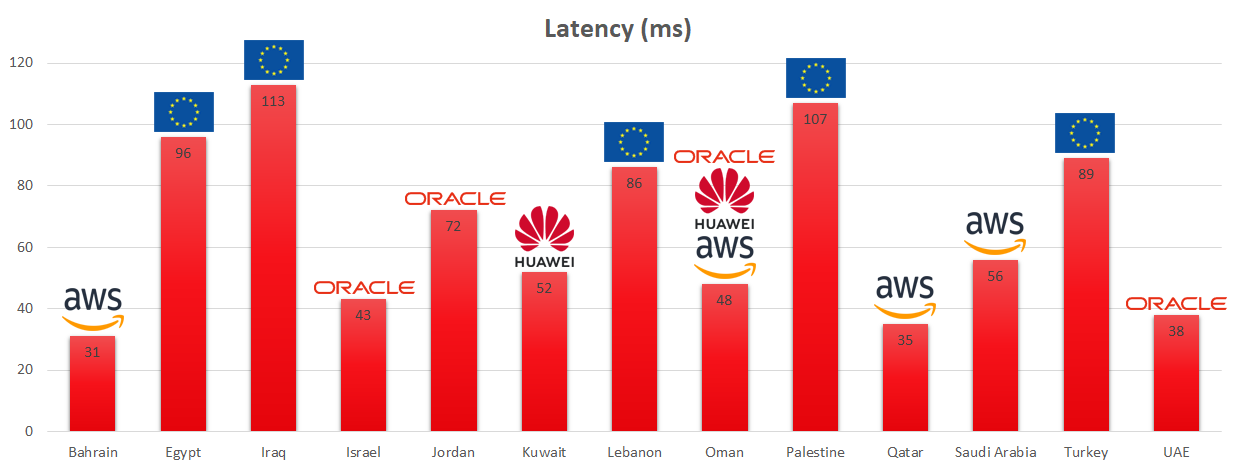
The current situation (2022)

As more cloud regions were launched the latency for all countries has improved considerably with many countries enjoying latencies of less than half their previous values. Only Iraq and Palestine exceed 100ms.

latency2022

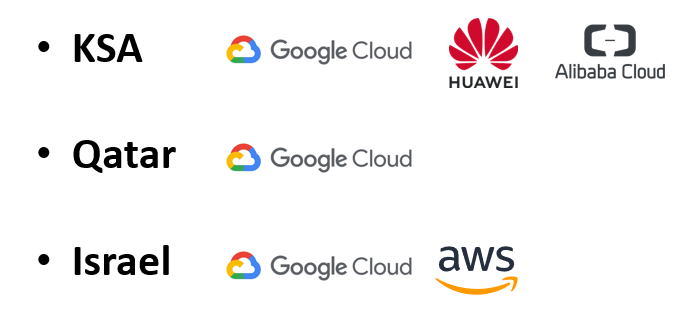
The future – New cloud regions being built

Further improvements are expected as Google, Huawei and Alibaba launch in Saudi Arabia, Qatar and Israel.

the future


ITU approves E.812 recommendation on crowdsourcing

After months of editing and collaboration work on E.812, which also included contributions from SpeedChecker, ITU approved the recommendation.

You can download the full text here.


Are you looking at a crowdsourcing solution that follows ITU standards?

SpeedChecker is an ITU associate member of Study Group 12. The solutions we build follow ITU recommendations. See our crowdsourcing solution presentation.

What Happened to the Internet when 7 million people visited Jeddah during Ramadan

Introduction 

In 2019 7 million visitors arrived in Jeddah during Ramadan (5th May to 3rd June) compared to its normal population of between 4 and 5 million. Google’s own insight report shows that demand increases during Ramadan as well. In this report we examine how the MNOs (Mobile Network Operators) coped with this increased demand. We analyse speeds between 17th April through to the 13th June to compare average download speeds before, during and after Ramadan.

Ramadan, Jeddah and the Internet

Internet Use Peaks During Ramadan

Internet use in MENA (Middle East and North Africa) during Ramadan is higher than any other time of the year. Google internal data shows huge spikes across several content categories on YouTube throughout the holy month each year, including TV & Comedy, Cooking & Recipes, Religion & Spirituality, Gaming, Auto & Vehicles and Internet & Telecom. Here is a chart from Google’s report in 2015 showing demand for TV and comedy downloads rising during Ramadan and falling after Ramadan.


MENA YouTube Viewership Ramadan 2015 from Google:

Chart showing peak demand for TV streaming during Ramadan


This peak is further emphasised in Google’s 2017 Ramadan Insight report in which they show:

“Watch time for content related to ‘TV drama series’ rises a staggering 151% in Ramadan compared to any other period in the year”

Google’s statistics are backed up by reports of increased smartphone usage during Ramadan such as this article from Mid East Information: Major surge in smartphone usage expected during Ramadan in KSA.

“Ramadan is one of the most active times of the year for social media in the Middle East – on all social media channels – as Muslims reach out to friends and family, prepare for the holy month, and celebrate in the run up to Eid.”

Jeddah Welcomes 7 Million Visitors

The Kingdom of Saudi Arabia issued over 7 million Umrah visas for 2019 and as of May 2019 6,964,943 have arrived in the Kingdom. Most of these will arrive in Jeddah because Jeddah airport is the gateway to the capital of the Kingdom of Saudi Arabia and it is the national air transport center.

Methodology

We analysed  data before, during and after Ramadan between 17th April and 5th June. This data was restricted to include only data that was:

  • Within the city of Jeddah
  • Cellular only (not fixed)
  • Provided via the top 3 MNOs operating in Jeddah (STC, Mobily and Zain)
  • Midday (12 to 2pm) or Evening (8pm to 10pm)

Jeddah was chosen because the number of visitors expected to pass through during this time could be expected to have a significant impact on the service provided by MNOs. We were keen to see how the MNOs coped during this time.

We chose to limit to cellular because this is the type of connection most likely to be used by visitors as well as local residents and therefore more likely to be impacted.

The top 3 MNOs (STC, Mobily and Zain) were chosen because they account for almost all connections in Jeddah.

We chose evening because we anticipated the demand to be high during those hours. Midday was chosen to compare the quality of service during two different parts of the day with different demands on the Internet.


Table showing dates when data was collected

Results

STC and Mobily achieved the best results with nothing to choose between them. Although Zain achieved lower speeds credit is given for sustaining their performance during this spike in demand.


Chart showing how Internet speed changed before, during and after Ramadan for STC, Mobily and Zain


We were also interested to see how performance varied during the day from the quiet of midday to the peak viewing / download time of the evening. Here we see that the speed in the evening was always well below the speeds achieved during the day. Even so, the evening speeds improved by 30% during Ramadan.


Chart showing how Internet speed changed before, during and after Ramadan by day


For Hajj last year (2018) the King Salman bin Abdulaziz and the Crown Prince Mohammed bin Salman issued a directive “to do everything possible to make it easy for pilgrims to perform the rituals of Hajj”. The initiative’s objective was to allow pilgrims to communicate with their families and enable them to access the digital services available in the Smart Hajj initiative. This was a great access as seen in our report from last year.

Although we didn’t see any similar initiatives being advertised in Jeddah during Ramadan it appears from our results that efforts have been made by MNOs and the Kingdom to sustain performance during this high demand.

Conclusion

We expected to see that as more and more people arrived in or passed through Jeddah during Ramadan that the speeds achieved would fall and then return to previous levels as the demand diminished. However, all three MNOs achieved remarkable results showing an increase in measured speeds during Ramadan compared to the weeks before. Although there was some reduction in speed after Ramadan it seems to have sustained a higher level than before. As discussed previously, the increased demand for Internet was predicted well in advance giving MNOs ample time to prepare. We can only assume that they used this time wisely and their customers (and guests) reaped the benefit.

It is heartening to see that there seems to be a residual benefit to customers of all three MNOs with the speeds after Ramadan being higher than before (if not quite as high as experienced during Ramadan).

EE Tops the Charts at Glastonbury

EE Tops the Charts at Glastonbury 2019

The 200,000 festival goers at the 2019 Glastonbury Festival were treated to free 5G via temporary masts installed by EE as it became the UK’s first 5G connected festival. In this report we look at what this meant for the music lovers as they enjoyed the music over 5 days in the English countryside. Did EE customers notice an improvement? How did the other MNOs fare?


Photo of crowds at Glastonbury
Photo of crowds at Glastonbury. 2017 Image courtesy of creative commons. Cropped to fit.

Temporary 5G Network Installed by EE to Serve 200,000 Users

EE (owned by BT) have installed 5 temporary masts across the 900 acre (3.5 square kilometres) festival site to broadcast 5G for the first time. The same masts are also providing 2G, 3G and 4G. They have a free 5G-powered Wi-Fi for the 200,000 festival goers to connect to.

In previous years the demand for mobile data during the festival was huge and this year will be even greater. During the previous festival (2017) 54 terabytes of mobile data was used and it is expected that this year it will be 40% higher at 70 terabytes. Possibly higher if the temporary EE 5G network is successful. Research from EE shows that the typical Glastonbury-goer will “watch 16 different performers and post a minimum of 12 videos on social media documenting their experiences at Worthy Farm – resulting in 2.4 million uploaded throughout the weekend”.

The image below is an example of the temporary masts erected by EE at Glastonbury to provide improved 2G/3G/4G service as well as 5G.


Photo of EE Temporary mast at Glastonbury
Photo of EE Temporary mast at Glastonbury. Image courtesy of pedroc.co.uk

Methodology

We started collecting data when people started to arrive on Wednesday and continued through to Sunday. We concentrated on results in and around Worthy farm and only analysed cellular results. The only residential area was the small village of Pilton (population < 1000) which means that by restricting our analysis to cellular we can be sure that most of the data came from festival goers.

The image below shows the remoteness of the festival and how challenging it can be to provide a good service. The circle shows an approximation of the geographical area covered by our results.


Aerial view of Glastonbury showing internet data coverage
Aerial view of Glastonbury showing internet data coverage. Image courtesy of Google.

There are many factors that can affect the quality and accuracy of a speed test on a mobile device and we are able to take these into account to grade each result in terms of reliability. For this study we decided to only use the most reliable 2500 taken during the festival.

Results

Our analysis is based on 2500 measurements from 468 unique devices including 145 different models, 23 manufacturers and 4 MNOs taken over the 5 days of the festival. We compare the performance of the MNOs, the devices and also show how performance varied from day to day.

MNOs

During the festival 4 mobile network operators (MNOs) provided internet to the festival goers with EE, O2 and Three being the most popular. The results show that EE was able to provide nearly twice the average download speed with Vodafone clearly in second place but still very much slower than EE during the festival.


Glastonbury speeds for EE, Vodafone, Three and O2

Chart showing Download speeds by MNO

Devices / Phones

During the festival we collected data from 468 unique devices including 145 different models from 23 different manufacturers. Here are the top 10 fastest phones from our data collection during the Glastonbury Festival. The list is dominated by Samsung models 9 and 10 with the S10 being the best by far.


Glastonbury speeds for devices samsung galaxy, google pixel huwawi mate

Daily

The speeds were quite good on Wednesday when people started to arrive and the final preparations were being. The best day was Thursday, the first full day of the festival and speeds gradually fell away as more people arrived and as the bigger acts appeared. The bigger the act the more videos being uploaded to the Internet and the higher the demand on the services. EE performed particularly well on the final day being twice as fast as its nearest rival, Vodafone.


Glastonbury speeds for EE, Vodafone, Three and O2 by day

Chart showing internet speeds at Glastonbury on each day

Conclusion

Glastonbury festival goers have enjoyed excellent performance whilst enjoying the music in the English countryside with 30% enjoying download speeds in excess of 20 Mb/s. 20 Mb/s is also the average for all customers which is higher than expected and is due to the nearly 35 Mb/s average achieved by EE customers thanks to the provision of temporary masts by EE. Although these masts supported 5G we saw no 5G devices being used in our crowdsourced data sample of 468 unique devices.

Of course the real winner was music but EE must be very happy with their performance throughout the festival.

Speedchecker partners with DD-WRT to build world’s largest monitoring network

Speedchecker, a private company running large-scale software-based monitoring networks and DD-WRT, the most popular open-source router firmware, announce a partnership which will aim to build the world’s largest hardware probe monitoring network.


Under the terms of the partnership DD-WRT started including the Speedchecker Probe client within the DD-WRT firmware. DD-WRT users can opt-in to the Speedchecker network and get new features for their routers in exchange for providing bandwidth for Internet measurements.


Wi-Fi Speedchecker feature for DD-WRT
Image: Wi-Fi Speedchecker feature for DD-WRT


As Christian Scheele from the DD-WRT development team said:


“We are pleased to be part of this partnership to not only help fund the DD-WRT development but also be part of the project which enables Internet research be conducted on a large scale across many countries that are currently not represented in existing measurement networks”.


Since the soft-launch earlier this year over 2000 users of DD-WRT have already opted-in to the network, enabling Speedchecker to cover over 80 countries for its Internet measurements. Speedchecker offers access to its network to clients such as Microsoft and Oracle, as well as researchers in organizations such as LACNIC which publish Internet topology research.


CEO of Speedchecker Ltd, Janusz Jezowicz noted:


Historically, companies always had to make a choice of either running measurements from software probes with its wider coverage but lower accuracy, or rely on hardware probes which had limited coverage. With this partnership we are able to provide global coverage for hardware probes with low costs due to end-users running the tests on their own routers and not expensive custom hardware.


From friend to foe: Lessons learned from Google becoming our competitor

Every startup is rightly afraid of a new competition, especially if it comes from Internet giants like Google. The stories of how Google enters the market and dominates it in a few years are not new (such as mobile OS and Android, or recently browser wars with Chrome) . In some cases Google gets a slap on the wrist or occasional $2.7 billion fine . Nevertheless, the situation is not likely to improve and Google’s dominance in search will grow into other areas, if Google decides to compete there.

This blog post hopes to give an insight into the impact of prioritizing Google funded initiative over existing players in the market, using the real numbers from specifically our small business (which I am not sure is still right to call a startup after 10 years) 😊

But before I do so, let me give you a super quick overview of what my company – Speedchecker does – we provide easy to use and accurate speed test of your internet connection. After almost 10 years we have done over 300 million tests and provided speed test technology for many other companies.


Launching Google speed test

The story begins about a year ago when Google launched their own speed test featured directly in search results in USA and followed by other English speaking markets. We knew that the UK launch would happen eventually but we did not know when.

Luckily for us Google picked an open-data solution for running their speed test , noble M-Lab. M-Lab was founded by internet visionaries such as Vint Cerf and is funded by consortium of companies including Google. This choice enabled us to analyze the rollout and provided real numbers for this blog post.

M-Lab speed test data is available to download for everyone through Google Cloud (of course). By analyzing volumes of data each day, we could produce following chart:


chart-google-test


(Number of speed tests from UK in M-Lab dataset on random days in May, June and July 2017)

As we can see, Google started  the rollout on the 15th of May. We can also observe that Google did not do an immediate rollout across all the UK users but over the course of several days, the feature was introduced to more and more users in the search results.


Impact on visitor numbers to our website

Here is how the search results look like in the UK for one of our main keywords:
broadband speed test Google Search


As we can see Google speed test occupies significant space on the 1st page and pushes all results below.

Here is the chart plotting user visits from Google (and Bing for comparison) before and after the Google speed test release. We can observe the drop in visitors begins after Google launches the speed test.


google-vs-bing (1)


To better illustrate that the drop is because of ranking change and not seasonal factors, here is zoomed in data from Bing which does not show any meaningful change before/after 15th of May when Google launched.


bing (1)


Looking at the average drops we can estimate the loss of about 5000 visits per day from 25000 Google visits. Overall that is about 20% traffic loss from being moved from position 1 to 2.

Comparing to industry standard data e.g. by RankScience, 20% drop is quite a good result, it could be worse.


rankscience


From M-Lab dataset we can also extract quite interesting insights as it contains user IP address as well. If we cross-reference user IPs seen in M-Lab data with our internal data, we can see about 5% of users use both services. We can only speculate whether it’s a good result or not, definitely for the user it is useful to get information from 2 different sources and decide what is more relevant.

Conclusion

From our perspective we are quite happy the Google threat is not as serious as we originally thought. Loosing 10% of our overall traffic (and 20% of Google’s) will have impact on our bottom line but we will survive. Luckily, we provide other features that user’s appreciate such as mobile apps, storing results, mapping, comparisons and more. This I believe contributed heavily to such a small drop. I have no doubt many users will favor convenience of 1 click to get result in search results directly than going to 3rd party site such as ours. Unfortunately, there is nothing we can do to compete with that and stay in business at the same time.

With Google favoring their own speedtest, M-Lab datasets are growing at a rate of almost 1 million results per day and will achieve to serve as many customers in less than a year – something  we have achieved in the last 10 years. That is the power of Google search dominance.