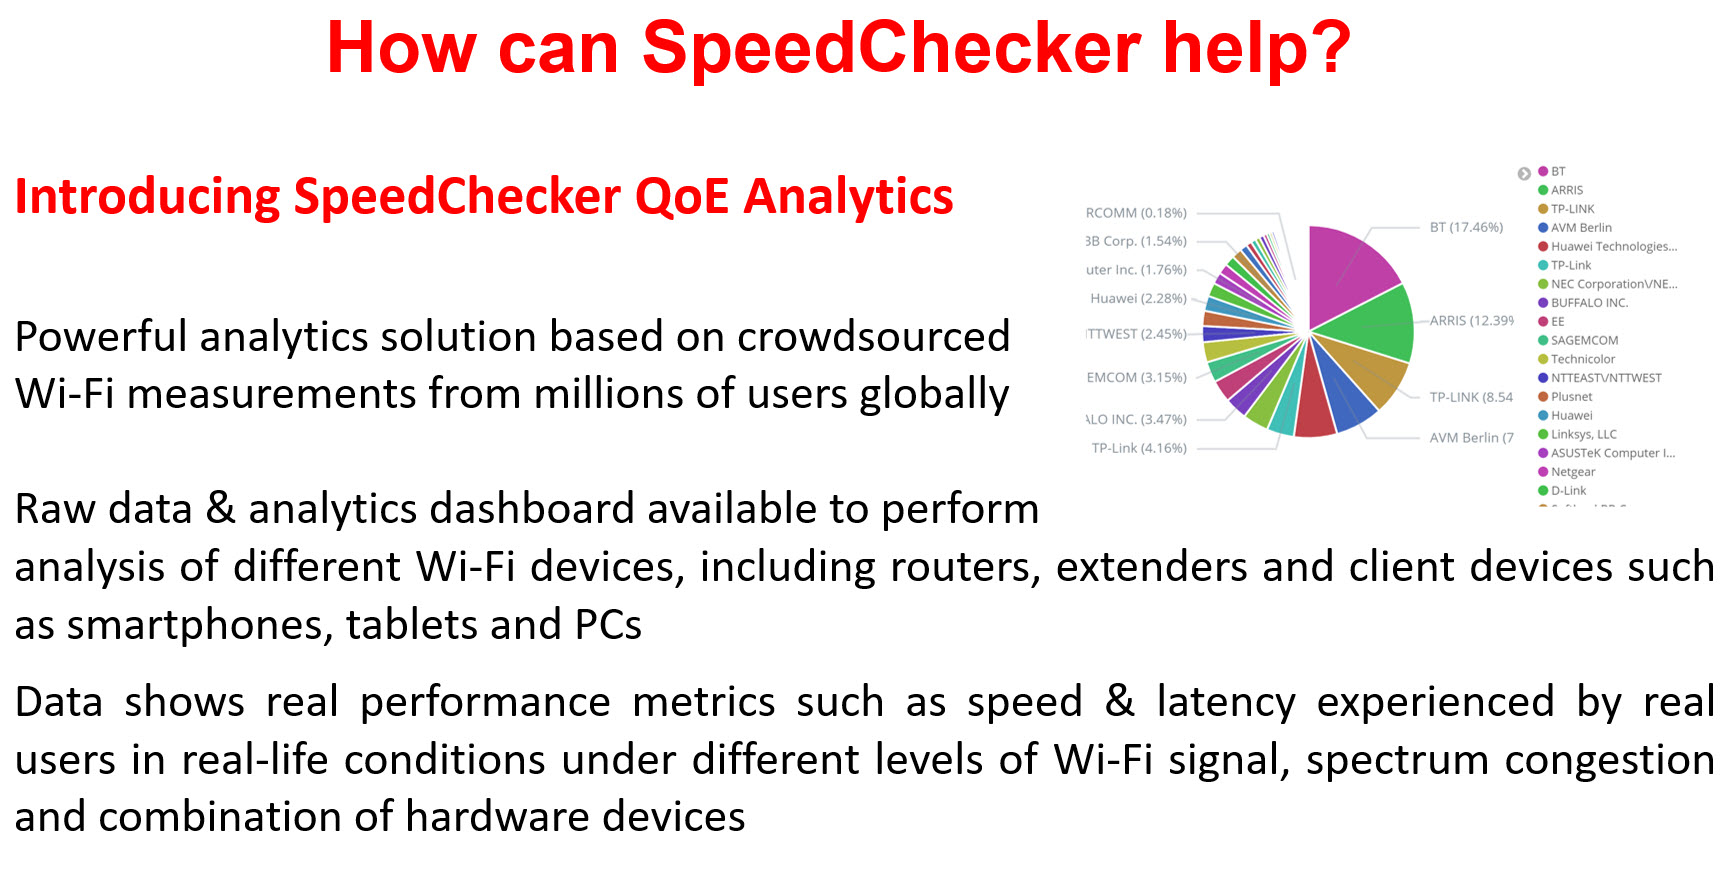
SpeedChecker analysed 300,000 speed test results to produce a Wi-Fi performance ranking of CPE (routers) around the World. Our results show that the choice of router has an important impact on the perceived speed of the Internet even for users of the fastest devices and the with the strongest signals.
In this white paper we explain how our methodology eliminates other causes of slow speeds and presents a ranking table of routers for the top 20 manufactures. We also show the cost of the routers to identify the routers that offer the best value for money. The conclusion of our study show that there are some clear differences between manufacturers and between the models that each provide.
- Ranking Methodology
- Method
- How SpeedChecker Filter the Data
- CPE (router) Manufacturer Ranking
- Conclusion
Ranking Methodology
The purpose of this white paper is to rank Customer Premises Equipment (routers) in order of Wi-Fi throughput, to help consumers and providers to diagnose slow internet connections. There is often disagreement between the consumer and the provider regarding where the fault lies for slower than expected Internet connections. There are many causes for a slow internet and this white paper explores the impact of the CPE (router) on the final speed perceived by the consumer.
In this section we explain the methodology used to ensure that we are able to confidently rank routers to identify the fast and slow routers. This will help to diagnose poor speeds because the data will allow the consumer or provider to know what to expect from the routers being used. The methodology is designed to allow for a fair comparison between routers.
This white paper is based on 300,000 speed results collected between 1st April and 10th June 2019.
We analysed these 300K results and filtered them to eliminate other factors that could be reducing the speed of the CPE. We eliminated any speed tests that failed our rigorous accuracy check, any tests that used devices not capable of the fastest speeds and any tests that had a poor signal quality. We also disregarded very strong signals that may not have been representative of the average user. Finally, we disregarded any model of testing device or router that had a small data sample. From the 300K we found 46K that met our criteria.
Because of the filtering, we have reduced the CPE models to the most popular ones used by the users. A more comprehensive study ranking a wider set of CPE models will be published in the future.
Countries
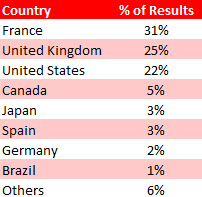
Our data set includes results from over 100 countries however the vast majority of results are from France, the United Kingdom and the United States.
Client Devices
During the time that SpeedChecker collected results there were over 600 different client device models used (mobile phones & tablets). To ensure that the devices themselves were not the cause of a slow connection we removed results from slow devices, those with insufficient results and those that were not using the 2.4 GHz band.
We removed devices that had a maximum link speed of less than 100 Mb/s and an average throughput of less than 30 Mb/s.
There were 75 devices that met our criteria to be included in the analysis of the CPEs (routers). These are all Android devices because data from iOS devices was not available for this study. SpeedChecker plan to include iOS devices in future studies.
The most popular fast devices in order of results per device:
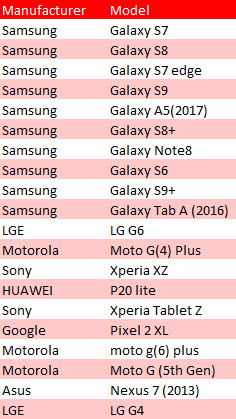
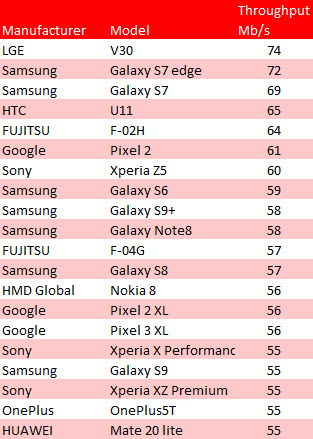
Samsung are clearly the most popular device but how do they compare in terms of throughput? The following table shows the average throughput in Mb/s for the top devices. Samsung have 5 of the top 10 but the fastest in our sample was the LGE V30.
CPE (Routers)
There were over 400 routers in our sample of 300,000. After eliminating the results from the devices as previously described there still remained over 360. However, for many of these routers there were too few samples to be statistically sound. Removing these left 78 routers that we could analyse with confidence.
Methodology:
- Wi-Fi Throughput Test
- Internet Download Test
- How SpeedChecker calculate a slow Wi-Fi connection
- Drawbacks of our methodology
Wi-Fi Throughput Test
The Wi-Fi Throughput Test shows the average maximum measured transfer speed between the device and the CPE (router) using the UDP protocol. Wi-Fi throughput will normally be higher than or equal to the Internet speed.
Internet Download Test
The Internet Download Test is the actual Internet speed experienced on the device during the SpeedChecker speed test using TCP protocol. Our test uses sophisticated procedures to ensure that the result is as accurate as possible.
How SpeedChecker calculate a slow Wi-Fi connection
In order to determine if a particular result shows that the CPE (router) was responsible for a slow internet experience, SpeedChecker compared the measured Wi-Fi throughput with the Internet Speed test. SpeedChecker looked at the Internet Speed as a % of the Wi-Fi Throughput. Any result that shows an Internet speed greater than 80% of the Wi-Fi Throughput speed indicates a slow CPE (router).
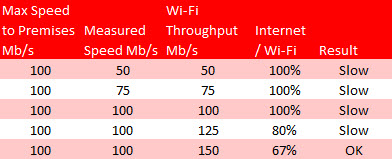
The following table assumes that a customer is being provided with a 100 Mb/s Internet connection and compares how a slow CPE impacts on the speed they actually experience. If the throughput is slower than the Internet being provided to the premises then the actual speed being experienced is limited to that throughput speed.
In the worst case we see that, although there is 100 Mb/s coming into the premises, the Wi-Fi throughput of the CPE is only 50 Mb/s. A better throughput of 150 Mb/s gives the customer the full 100 Mb/s that is being provided with a ratio of 67%. For our analysis we consider any speed test result that has a throughput speed between 80-100% of the measured Internet speed to be slow. In our ranking tables we include the % of slow results for comparison.
Drawbacks of our methodology:
Our results rely on the CPE (router) having UPnP enabled on the router. Although many routers have it turned on by default there are still a significant number of popular routers that will not appear in our list because UPnP is disabled by default on them. Some users may enable it on these but if there are not enough results to be statistically significant they will not appear in our tables.
Our methodology mitigates against the impact of the wifi setup such as poor Wi-Fi signal and slow/old devices by only including results with strong signals and those results from devices capable of faster speeds. We also mitigate against local impacts on the results during the test itself by eliminating poor results.
The steps that we have taken to ensure accurate ranking of CPEs means that the 300K raw results have been reduced to 50K high quality results to ensure a fair comparison.
How SpeedChecker Filter the Data to Produce Meaningful Results
The purpose of this report is to provide an analysis of the speed results to show the best routers in terms of Wi-Fi Throughput. This will allow comparison of routers (CPEs) and help to identify if the router is causing a poor internet performance.
It was important for us to ensure that we only used speed results that provide information that was reliable, significant and relevant to most users. To do this we filtered our results based on :
- Reliability
- Device Speeds
- Router popularity
- Wi-Fi Signal
- Wi-Fi Type
- Number of results per router and device
Reliability
SpeedChecker take great care to ensure that any speed test result that we use is reliable and accurate. The results that are eliminated include incomplete tests, tests with too few samples and tests that take too long to complete. This can be caused by local interference such as the user moving during the test, the user cancelling before completion and interference during the test by other devices or other apps.
Device Speed
Because we are interested in the performance of the CPE we have included only phones and devices that are capable of the faster speeds. Otherwise, it would not be clear if it was the router or the device that was causing the slowness.
We used the top 75 devices from over 600 devices in the raw data. These all had maximum link speeds of at least 100 Mb/s and we had sufficient results from each device to be statistically significant. To qualify for this list a device was also required to have a minimum of 250 results.
The average Wi-Fi Throughput for these devices ranged from 30 to over 100 Mb/s.
Router Popularity
We list the most popular routers based on the number of data samples for each router and their popularity in Europe. It should be noted that some of these routers are offered as ISP brands. A router needs to have sufficient results to allow for statistically sound analysis.
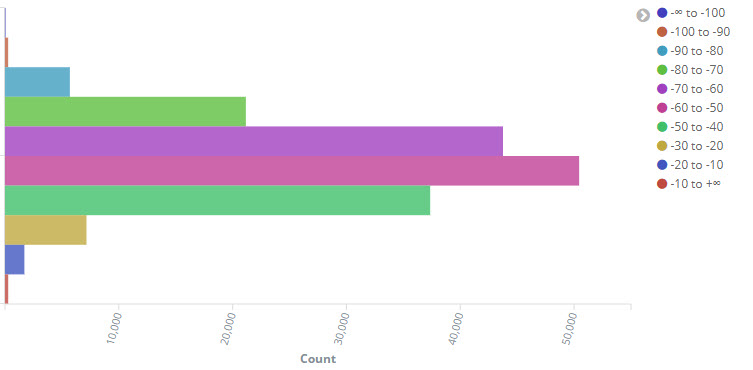
Wi-Fi Signal
A weak Wi-Fi signal will also produce slow results and would cause a router to be mis-reported as being slow. We looked at the number of results in each band of signal strength and, as seen in the chart, we saw that most of them were between -40 and -70 dBm. We filtered out any results worse than -70 dBm. We also filtered out strong signals (above -40dBm) to ensure that our analysis focuses on the more challenging wireless conditions where users typically struggle with wi-fi, and ideal conditions where most of the CPEs are working well.
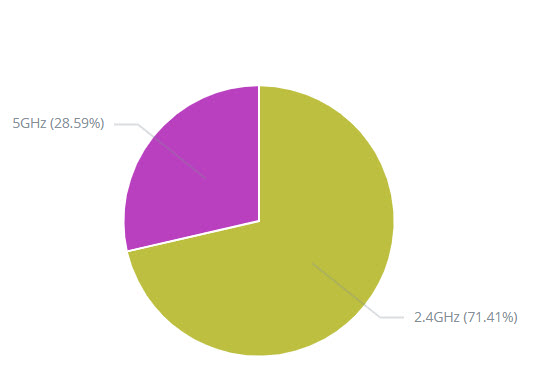
Wi-Fi Type (2.4 GHz or 5 GHz)
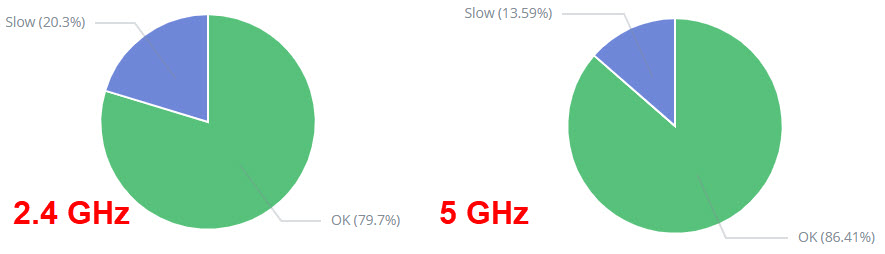
Our analysis restricts results to those using the 2.4 GHz band to make the comparison equal across all routers. We chose 2.4 Ghz because our results show that there are twice as many users of 2.4 GHz than 5 GHz meaning that most users will be using the 2.4 GHz band. We also see that there are 50% more slow results for 2.4 GHz compared to 5 GHz.
Number of results per router and device
Another filter that we apply to our results is to ensure a minimum number of results per device and per router. The restriction on the device (phone / tablet) was used in identifying the devices to be used to filter the CPE (router) results. These results were then further reduced if a router had insufficient measurements from these faster devices.
CPE Manufacturer Ranking
For the top 20 manufacturers the following table ranks the best CPE from each manufacturer in order of average Wi-Fi Throughput. We also give the average Internet Download speeds as measured by our speed test. The Slow % indicates the % of results for that router that were defined as slow by the metric discussed previously. We provide the cost where available to allow for a Value For Money comparison.
We provide further tables that include their other top-performing equipment in the section that follows.
[supsystic-tables id=1]
Ranking table of best models for each CPE manufacturer
Prices are given for CPEs that were available to buy at the time of writing and are in USD.
The Internet speed as measured by our Speed Test is provided to give an indication of the speeds expected by the consumer with most speeds between 20 and 50 Mb/s. A couple are much lower than that, particularly TP-Link Archer_C5. This should not be interpreted as a fault of the router especially in this instance where the slow % is only 2%. i.e. the router is not the cause of the slow internet speed. Most likely the slow internet speeds are linked to the actual router being popular in countries / ISPs which offer internet packages with low speeds.
Vendor-specific CPE Ranking Tables
The previous table ranks all manufacturers by their best-performing CPE (routers). In the following tables we take the top 10 manufacturers and include the overall ranking position.
There are no tables for Compal Broadband or Sercomm because they each have only one CPE in our results.
Arris CPE Ranking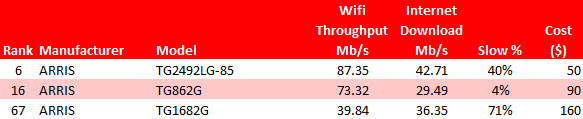
AVM Berlin CPE Ranking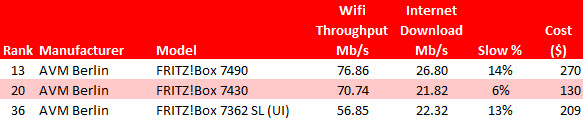
BT CPE Ranking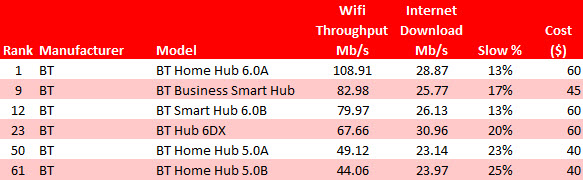
LinkSys CPE Ranking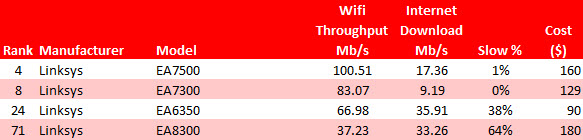
Netgear CPE Ranking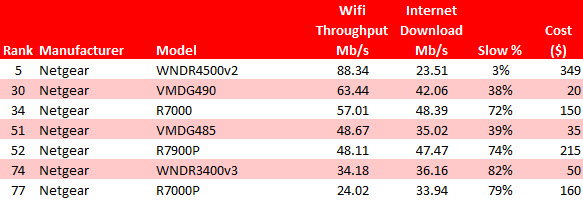
Sagemcom CPE Ranking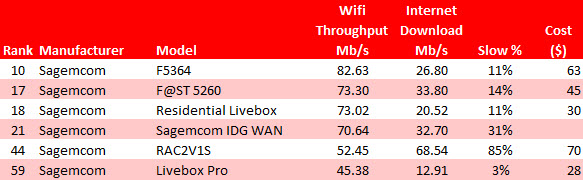
TP-Link CPE Ranking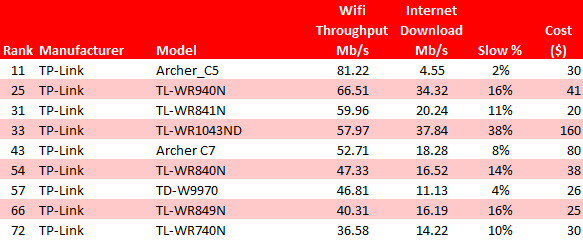
ZyXel CPE Ranking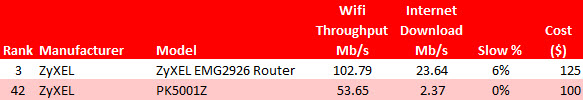
Conclusion
The results of our study show that there are some clear differences between manufacturers and between the models that each provide. Most manufacturers provide one or two routers that are significantly better than the rest, reflecting improvement in technology. For example, BT is releasing new versions of its models and we can see clearly from our data the wi-fi throughput increases with every version and showing it is worthwhile upgrading.
Although more connections are being made using the 5 GHz band than previous years, 2.4 GHz connections are still used twice as often. It is interesting to see that the percentage of slow connections using 2.4 GHz (20%) is 50% larger than for 5 GHz (13%). We conclude that most customers suffering with slow connections are still using 2.4 GHz and that is why we concentrated on this band. The reasons for this include the CPE (router) not having a 5 GHz band, the user not switching to 5 GHz either because of lack of knowledge or because they get better results on 2.4 GHz (because of distance, walls etc).
Routers from BT, Sercomm, Zyxel and Linksys topped the ranking in terms of Wi-Fi throughput, each being 10% faster than their rivals. The Linksys EA7500 and ZyXel EMG2926 were particularly impressive because their slow % was 1% and 6% respectively. Sercomm’s top router (the Livebox) had a faster throughput but a disappointing 19% slow %. If reliable performance is important then choose the Zyxel or Linksys router but if value for money is important then choose BT Home Hub 6 or Sercomm Livebox, each costing less than half of the others. The AVM Berlin Fritz!Box 7490 at $270 does not offer the best VFM, however, their second router (7430) at $110 is a better buy.
Only one manufacturer in the top 10 had a slow % below the average: the Arris TG2492LG-85 at a disappointing 40%. With a throughput of 87 Mb/s it performed well but if reliability is important then choosing their second fastest (TG862G) gives a respectable 73 Mb/s but only 4 % slow %.
Most manufacturers have some routers that have a wide range of slow %. BT is unusual in that the 6 routers in their table range between 13% and 20% with the throughput correlating with the slow % i.e. the faster the throughput the small the slow %. Netgear in contrast has a flagship router (WNDR4500v2) with great throughput and negligible slowness but 6 others that perform poorly in contrast. Linksys have two great routers and two not so great.
Contact Us
For more detailed information please contact us:
email: [email protected]
skype: jezowicz
phone: +44 203 286 3573
Contact Us Here