In an effort to bring ProbeAPI nearer to the internet measurement community, we’ve been paying close attention to the new LMAP specification for internet measurement platforms. LMAP is being defined with the goal of standardizing large scale measurement systems, in order to be able to perform consequent measurements among diverse entities. They may even differ in implementation details, but complying to this standard opens the possibility of making the components, results and instructions comparable.
“Amongst other things, standardisation enables meaningful comparisons of measurements made of the same Metric at different times and places, and provides the operator of a Measurement System with criteria for evaluation of the different solutions that can be used for various purposes including buying decisions (such as buying the various components from different vendors). Today’s systems are proprietary in some or all of these aspects. “ – RFC 7594, July 2015
In order to find out how compliant or non-compliant ProbeAPI might be toward this standard, we started a design and implementation comparison in terms of an LMAP system. In this post we will focus on the general outline of the system, oriented to its main components, their roles and data flow. A detailed comparison for a data model and measurement methods will have to remain pendant for a dedicated post, since they are very extended topics.
The general working scheme of ProbeAPI includes most components from the LMAP specification in very similar roles:
The user with the API makes a measurement request. The API, hosted in the cloud, then communicates the testing instructions to the Controller Interface, which will forward the testing instructions to the Bootstrapper and Controller outside the cloud. The Bootstrapper part is in charge of integrating the probes to the whole system and updates the database to keep track of the disconnecting probes. It is implemented using an XMPP server, which uses a sleek protocol and allows for all the probes relevant to a particular measurement to receive the message simultaneously.
The probes themselves report their online status directly to the API, while the Bootstrapper keeps track of the ones that disconnect. The probes receive the measurement instructions from the Controller. After carrying them out, they will send the results directly to the API to be delivered to the user.
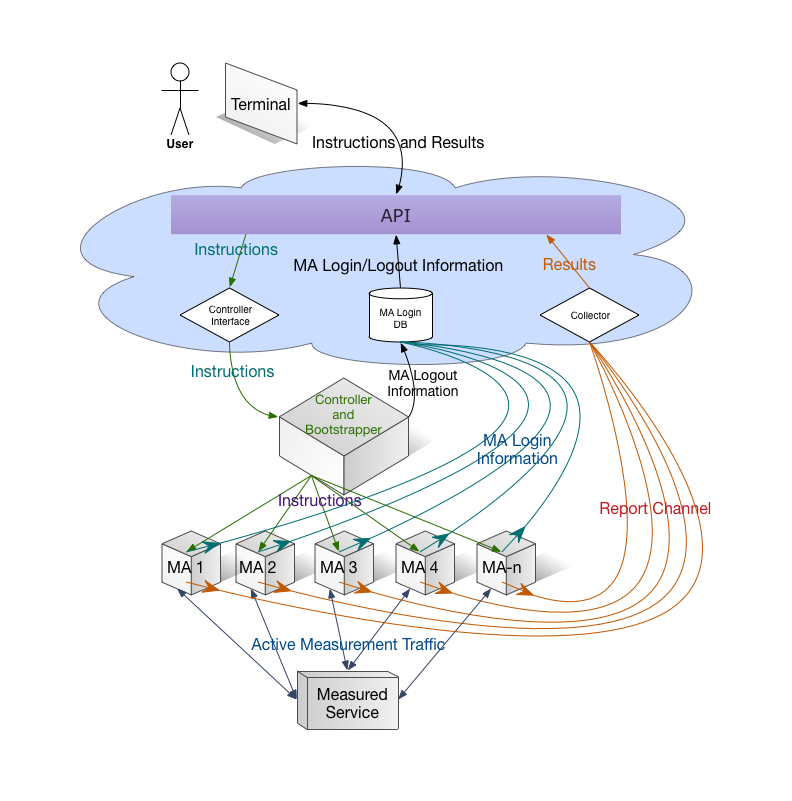 The Controller and Bootstrapper component mixes the Controller part, which is an element inside the scope of LMAP while the Bootstrapper lies outside the LMAP scope.
When a new probe becomes online, it generates its own unique ID which will be sent together with the results, where they can be separated in terms not only of ProbeID, but also ASN or Country. Then it calls the login method from the cloud interface so it will be accounted as online. When a Probe logs off, it is the Bootstrapper service which accounts their disconnection to the Database.
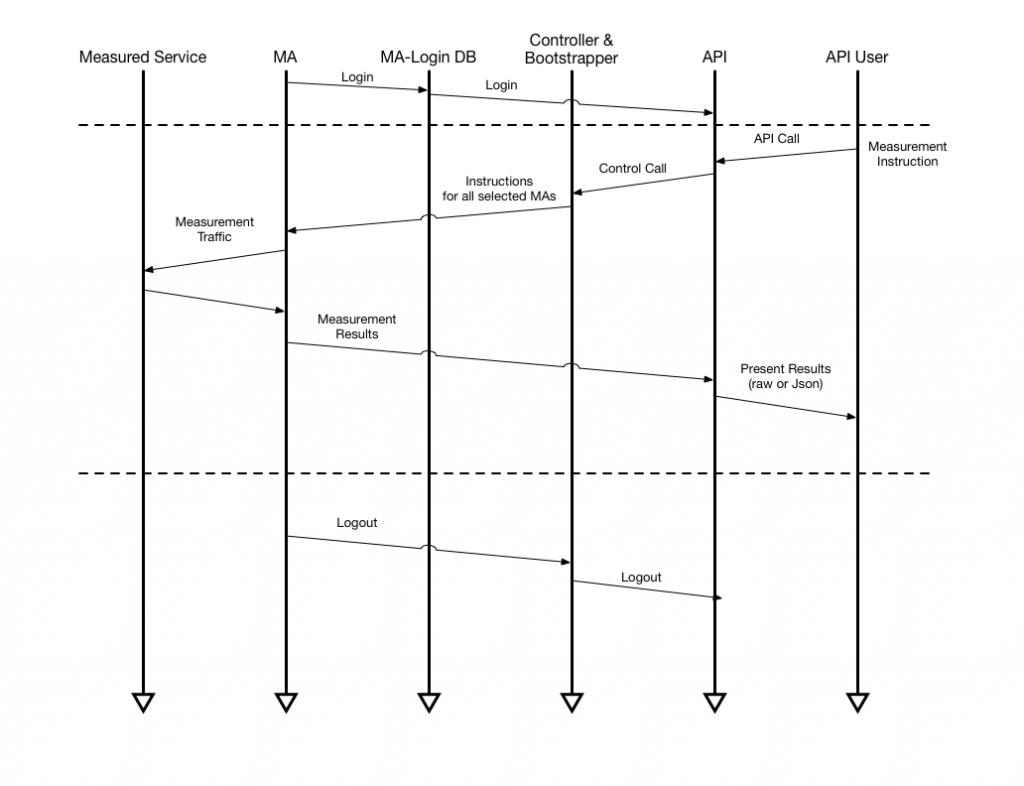
When a measurement instruction is sent, the Control Protocol is an XMPP instruction which can contain, for example, the following information:
- <Task-ID>Task-ID
- <MA-ID>Probe-ID
- <suppression>TimeOut
- <instruction>Command
- <parameter> host_address
- <parameter> ttl
- <parameter>count
- <parameter>timeout
- <parameter>sleep
- <parameter>BufferSize
- <parameter>fragment
- <parameter>resolve
- <parameter>ipv6only
There is a Task-ID generated from the API, which is passed over to the probe with each measurement. When the results are collected, they are easily recognized. Failure information from the Measurement Agents will be included in the results.
Here is an example of the results header obtained for httpget measurements:
- HTTPGet_Status
- HTTPGet_Destination
- HTTPGet_TimeToFirstByte
- HTTPGet_TotalTime
- HTTPGet_ContentLength
- HTTPGet_DownloadedBytes
- Network_NetworkName
- Network_LogoURL
- Network_CountryCode
- Network_NetworkID
- DateTimeStamp
- Country_Flag<url>
- Country_Name
- Country_State
- Country_StateCode
- Country_CountryCode
- Probe-ID
- ASN_Name
- ASN_ID
- Location_Latitude
- Location_Longitude
The possible measurements at the time are:
ICMP (ms) , HTTP-GET (ms), Page-Loading time (ms), DNS Query Time.
The API itself doesn’t offer scheduling functions yet, but they are being implemented. Since ProbeAPI’s measurements are active. Each MA measures normally one flow per instruction. The report Data can be presented Raw or formatted in Json. There are also plans to implement scheduling also for reports. Right now reports are immediate.
There is also no Subscriber Parameter DB, since this information is delivered directly with the results from the probes. AS-Number, Country, AS-Name and Geographic Location are provided directly with the results.
