Background
In recent years crowdsourcing has become a popular method to evaluate quality of service of telecommunication networks. In May 2020 recommendation E.812 : Crowdsourcing approach for the assessment of end-to-end quality of service in fixed and mobile broadband networks, has been approved in ITU Study Group 12.
Crowdsourced data has following advantages over traditional probe-based data collection systems:
- Crowdsourced data contain large amount of geographically diverse measurements
- Since the measurements are collected from end user mobile devices, geographic distribution of the measurements follows the population density
- They are more representative of the actual user experience
- They not only support active measurements but also can monitor passively the network utilization from the mobile device during the time the users perform their normal activities
- They reveal additional information such as handset usage
For the purpose of disaster mapping their additional benefits such as:
- Device GPS sensor can provide accurate position of the measurements
- Large amount of data samples can provide better view of the size of the impact area
- Measurements can be scheduled remotely without the need to place the probes in advance
More information can be found in E.812.
In 2020 ITU and SpeedChecker started evaluating a concept of using crowdsourced QoS measurements for disaster connectivity mapping. A prototype Disaster Connectivity Map (DCM) was built and tested on an ITU server, which takes measurement data provided by SpeedChecker.
Data collection methodology
Data is collected from end user devices running Android and iOS systems. SpeedChecker partners with 3rd party app publishers which have popular apps in the stores. SpeedChecker offers a mobile SDK (https://github.com/speedchecker/speedchecker-sdk-android) that can be integrated into 3rd party apps. End users opt-in to providing accurate location to SpeedChecker. SpeedChecker anonymizes the results and all reports are built on aggregated data which does not reveal user identity or compromises user’s privacy.
All measurements are executed towards a CDN which has a large geographical footprint and hosts a significant part of the content that is being accessed by the users. This ensures the results are a good approximation of the user’s actual quality of experience. All measurements must contain accurate location information using GPS or wi-fi geolocation method. Measurements are considered only from the apps that have been approved by SpeedChecker. Submitted measurements are checked if they are within expected ranges and additional security precautions are implemented to ensure measurement data is not being manipulated.
Diagram of the SpeedChecker crowdsourcing system

Baseline measurements show connectivity performance map


During 2020 a series of measurement campaigns were executed by SpeedChecker which were used to produce baseline maps in the DCM which show connectivity performance in selected countries under the normal (baseline) situation without any disaster event happening.
SpeedChecker delivered approx 30,000 measurements in the period of 7 – 14 May 2020 for three pilot countries of Dominica (3,805 points), Fiji (11,775 points), and the Philippines (15,406 points). Each measurement consisted of ping (Ms) + download speed (Kbps) + upload speed (Kbps), Latitude, Longitude, Country, City, Connection, Platform, Network, and IP Address.
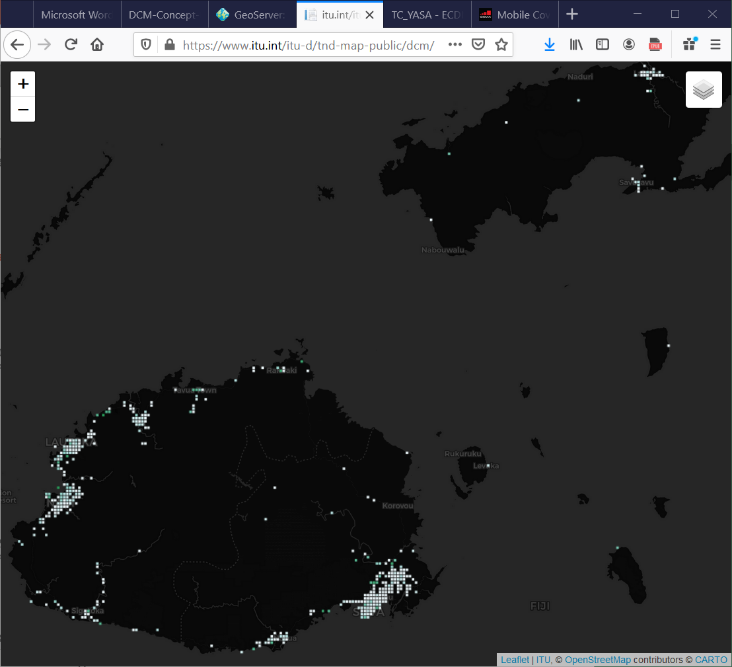
The results showed a good spatial distribution of datapoints within these countries, in line with population density. In the prototype DCM the measurements are then processed in an SQL database to be aggregated by space and time, before they are plotted as a point grid on the map.
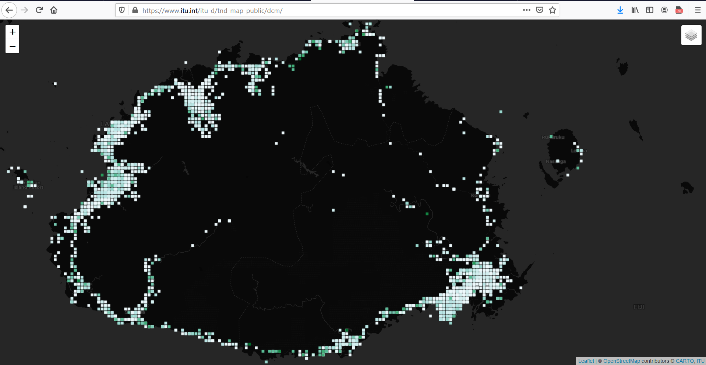
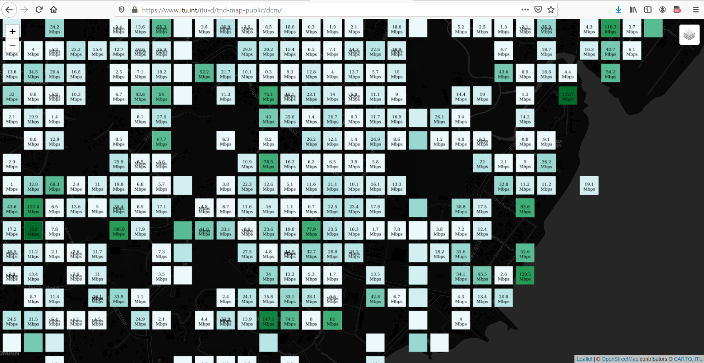
These maps to the right show the point grid produced for Fiji, with individual datapoints aggregated into grid cells at a resolution of 1 sq.km increasing to 100 sq.m and 10 sq.m to show more granularity as the map is progressively zoomed in to the capital city of Suva. This method also further anonymises the spatial location of individual users providing input measurement data.
From this measurement data a bandwidth surface can also be generated for each measurement type (ping, download speed, upload speed) by interpolating these known points to estimate performance in all those other places without measurement values.
This bandwidth surface can be displayed as a heatmap, raster, or as bandwidth isolines (or “contours”). Dynamic bandwidth contours can be produced in near real-time because as the underlying data points change, the map changes automatically as map is rendered on-the-fly.
Real time measurements detect network outages during disaster events

The prototype Disaster Connectivity Map was tested in a real time disaster situation during December 2020, when category 5 tropical cyclone Yasa hit Fiji from 16 – 18 December 2020. The 11,775 measurements taken in May 2020 provided a reliable baseline to show where and what was the level of connectivity across Fiji under normal circumstances.
At the request of ITU, SpeedChecker started a new measurement campaign on 16 December which lasted for five days and delivered 68,207 measurements in the period of 17 – 21st December. Tropical storm Yasa made landfall on island of Vanua Levu in the early morning of 17 December, with high winds and flooding causing significant damage and network outages along the path of the storm across the islands of Fiji.
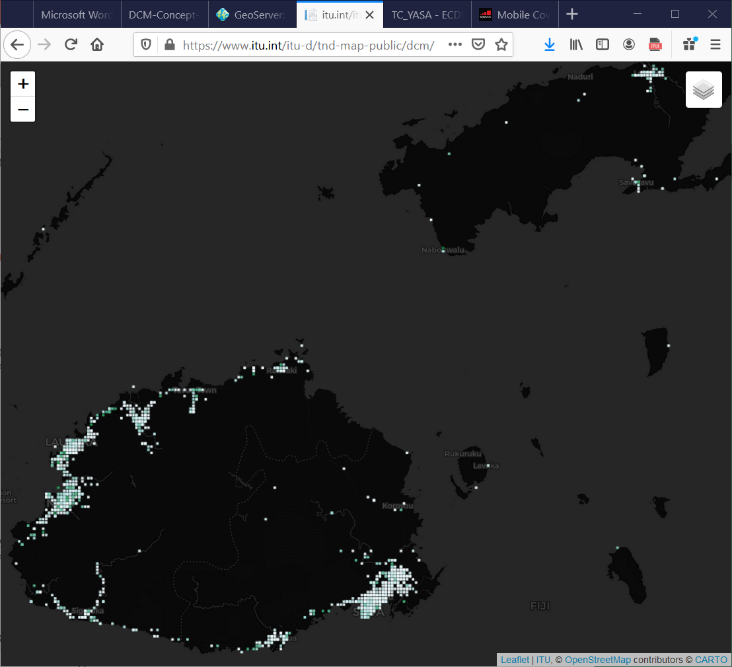
The maps from the DCM prototype to the right show a clear pattern in which connectivity is reduced across most of Fiji on 17 December, and then gradually returns over the course of the next three to five days but that there are some places in Vanua Levu and other islands where persistent connectivity gaps and network outages remain.
The number of measurements obtained over the five day period is also telling compared with the baseline of 11,775 results obtained in May 2020. A total of 4,101 results were obtained in the 24 hours until 17 December (approx one third of the baseline), which increased to 7,919 results on 18 December (approx two thirds), and had returned to the normal level of 12,442 results on 19 December.
Of the total of 68,207 measurements taken during this period, seventy percent (47,646) were obtained from mobile devices connected to cellular networks. By comparing the location of these datapoints against cell towers it was possible to determine which individual cells had been either ‘seen’ or ‘not seen’ during the period. Cellular network coverage was filtered on this basis, to show which cells sites were not seen.