Speedchecker partners with DD-WRT to build world’s largest monitoring network

Speedchecker, a private company running large-scale software-based monitoring networks and DD-WRT, the most popular open-source router firmware, announce a partnership which will aim to build the world’s largest hardware probe monitoring network.


Under the terms of the partnership DD-WRT started including the Speedchecker Probe client within the DD-WRT firmware. DD-WRT users can opt-in to the Speedchecker network and get new features for their routers in exchange for providing bandwidth for Internet measurements.


Wi-Fi Speedchecker feature for DD-WRT
Image: Wi-Fi Speedchecker feature for DD-WRT


As Christian Scheele from the DD-WRT development team said:


“We are pleased to be part of this partnership to not only help fund the DD-WRT development but also be part of the project which enables Internet research be conducted on a large scale across many countries that are currently not represented in existing measurement networks”.


Since the soft-launch earlier this year over 2000 users of DD-WRT have already opted-in to the network, enabling Speedchecker to cover over 80 countries for its Internet measurements. Speedchecker offers access to its network to clients such as Microsoft and Oracle, as well as researchers in organizations such as LACNIC which publish Internet topology research.


CEO of Speedchecker Ltd, Janusz Jezowicz noted:


Historically, companies always had to make a choice of either running measurements from software probes with its wider coverage but lower accuracy, or rely on hardware probes which had limited coverage. With this partnership we are able to provide global coverage for hardware probes with low costs due to end-users running the tests on their own routers and not expensive custom hardware.


Brand new shiny and polished Internet measurement API

After a few months of hard work we are pleased to announce a new version of our Probe API. We decided to completely rewrite the API specification to apply all the things we have learned over the last few years without breaking API access for our existing user base. We don’t plan to sunset the old API version yet, but new clients are not able to sign up for the old version.

The new version is so much better; we have made following improvements:

Easy to use
Our API is well documented including a Quickstart guide which will get you up to speed quickly so you can start running your measurements.

Reliable
We have learned a lot of lessons over the years about how to make the API more scalable . We are pleased to say the new API already supports millions of measurements running every day!

Multi-platform
As part of new API release we are offering access to our Android probes to all of our users. API users can leverage increased coverage by testing on all available platforms, or specifically target mobile probes using Platform source targeting. We will soon have an announcement about hardware probes which will be supported in the same way, without the need for code changes.

Great level of support
Being a small company, we have always taken personal care of each client and made sure our support team provides expert advice on internet performance measurements to assist clients in fulfilling their goals.

Transparent pricing
Our API access starts from 49 EUR per month.
Please check our pricing here.

API Features

On top of those improvements mentioned above the API features also got an upgrade. Based on feedback we got from our users we have improved the API methods to include:

Improved probe targeting

Our new API offers many more options on how to select probes for measurements. Our users can select probes by location (e.g. City / Country / Lat and Long coordinates), network (Network name, ASN or IP prefix) and more.

More information about probes
Using ProbeInfo properties API users can specify what information about the probe is useful for them to return with the measurement results. We have added new properties such as DNS Resolver IP, Screen size (useful for page load tests), User connection type and more.

Extended tests and new metrics
Our API supports existing measurements such as Ping, DNS, Traceroute, HTTP, Webpage load. We have also added a new measurement type – video streaming test.

Further changes to the API endpoints:

Ping
We added an option to run TCP ping.

DNS DIG
DIG command now responds with full DNS query information .

HTTP
We now have available metrics such as TTFB, TotalLatency, DownloadedBytes, TCP connect time.
HTTP GET measurement can also return full HTTP Headers and Body. This can be very useful for many scenarios such as finding out which CDN POPs are being accessed, CDN cache HIT/MISS analysis, keyword monitoring in the HTTP response. The possibilities are endless!

Webpage load
We offer all the web performance metrics you would expect and we have added a couple more: such as the number of requests the page has loaded as well as full HAR file. HAR file is very useful in getting a complete picture of the pageload performance and allows you to construct a waterfall model which we use in our CloudPerf product.

Free trial

We hope all the improvements we have made will encourage you to sign up for our 7-day FREE trial.

How to pick the best server based on Latency and Throughput

Choosing an optimal server location isn’t necessarily an easy task. Managing costs and selecting an appropriately sized hosting package is just one part of the deal. As much or more important than server capacity, is finding out how your services behave from your client’s perspective. Whether it is for choosing among different hosting providers or deciding in which location it is better to deploy your server, you need to measure latency and throughput. Having an insight into these two metrics can improve your service and result in cost-effective solutions.

In this article, we take a look into these two basic aspects of connectivity: latency and throughput. We discuss their behavior and show you how to use CloudPerf to compare and choose an optimal server for deploying a web page.

As we know, TCP performance is naturally limited by Latency. As for this, the first aspect we have to look into a server’s performance is Latency, then focus on throughput. No matter how big a link may be, if your users experience a high latency, it is not possible for them to achieve high performance. The next graph, shows the interdependency of Thoughput vs. Latency.

tcp-speed-limit

Here we can observe an inverse exponential curve, which in practical terms, it means that especially in the 1-30ms range, every millisecond of latency will have a heavy effect on the maximum achievable performance. With this in mind, we can picture very clearly the intuitive notion of choosing a server as close as possible to your clients, but still take into account even the smallest differences in latency.

Let’s say we have an account with a cloud provider and we want to deploy a service for European users. We can take Digital Ocean as an example, where we can deploy a VM in Amsterdam, London or Frankfurt, among others. We deploy the same test service on each of those locations. Then we set up a Static Object measurement for them in CloudPerf pointing to a 100KB test file and a Ping measurement to each server. We make sure to select the countries of our interest and start measuring. We choose to measure for one hour, one measurement per minute.

The following table shows the latencies obtained from each location to each of the three servers. The lowest latencies have been highlighted in yellow.

latency-table

We can observe that depending on the countries we are serving to, we can expect a very different result for each server. But focusing on all countries altogether, we can say that Amsterdam and Frankfurt have the lowest latencies in general. Let’s confirm that with the graph:

latency-graph

This is one for latency, but what about throughput? Given similar enough latencies, like in this case, the effective TCP Throughput may be affected by other factors, so we take a look at the download speeds achieved for each server, now the highest Throughput has been highlighted in yellow.

throughput-table

Here we can clearly observe that clients from Austria and Germany, which showed ping values favorable to the Frankfurt server, actually show a higher throughput when serving from Amsterdam. Let’s take a look a the graph:

throughput-graph

No we have confirmed that our Amsterdam server will show the best performance. Of course results will vary depending on which countries we focus on, but we can clearly see a general advantage of using Amsterdam as a single location for this selection of countries.

From friend to foe: Lessons learned from Google becoming our competitor

Every startup is rightly afraid of a new competition, especially if it comes from Internet giants like Google. The stories of how Google enters the market and dominates it in a few years are not new (such as mobile OS and Android, or recently browser wars with Chrome) . In some cases Google gets a slap on the wrist or occasional $2.7 billion fine . Nevertheless, the situation is not likely to improve and Google’s dominance in search will grow into other areas, if Google decides to compete there.

This blog post hopes to give an insight into the impact of prioritizing Google funded initiative over existing players in the market, using the real numbers from specifically our small business (which I am not sure is still right to call a startup after 10 years) 😊

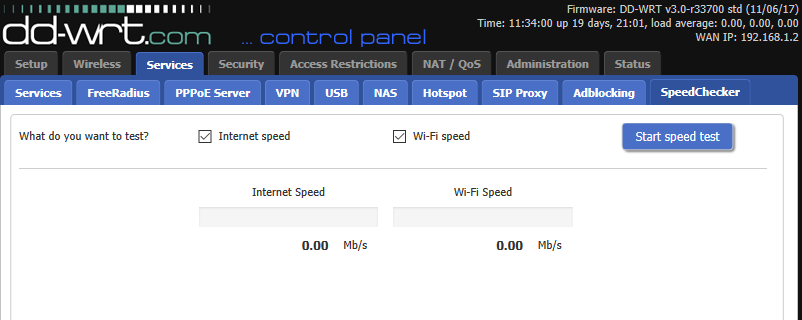
But before I do so, let me give you a super quick overview of what my company – Speedchecker does – we provide easy to use and accurate speed test of your internet connection. After almost 10 years we have done over 300 million tests and provided speed test technology for many other companies.


Launching Google speed test

The story begins about a year ago when Google launched their own speed test featured directly in search results in USA and followed by other English speaking markets. We knew that the UK launch would happen eventually but we did not know when.

Luckily for us Google picked an open-data solution for running their speed test , noble M-Lab. M-Lab was founded by internet visionaries such as Vint Cerf and is funded by consortium of companies including Google. This choice enabled us to analyze the rollout and provided real numbers for this blog post.

M-Lab speed test data is available to download for everyone through Google Cloud (of course). By analyzing volumes of data each day, we could produce following chart:


chart-google-test


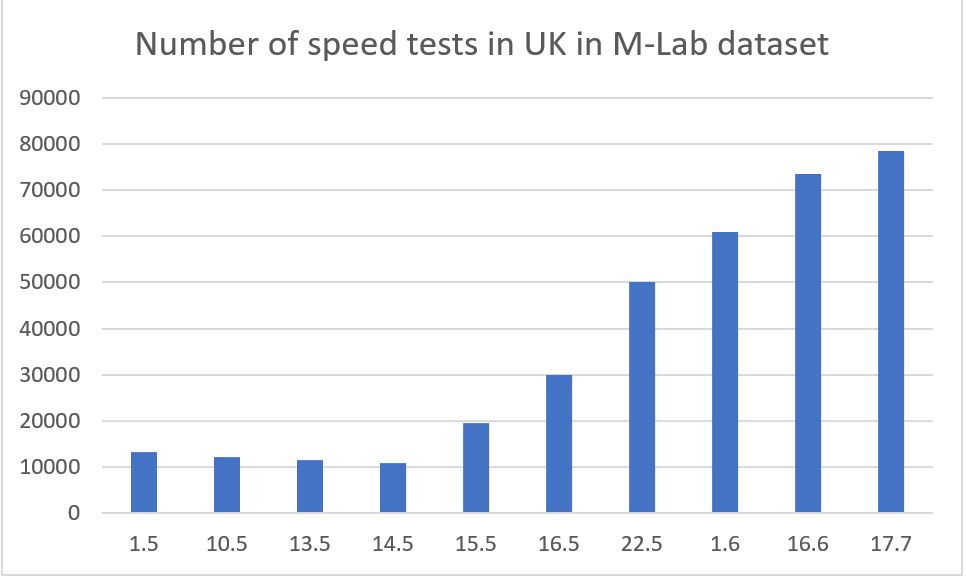
(Number of speed tests from UK in M-Lab dataset on random days in May, June and July 2017)

As we can see, Google started  the rollout on the 15th of May. We can also observe that Google did not do an immediate rollout across all the UK users but over the course of several days, the feature was introduced to more and more users in the search results.


Impact on visitor numbers to our website

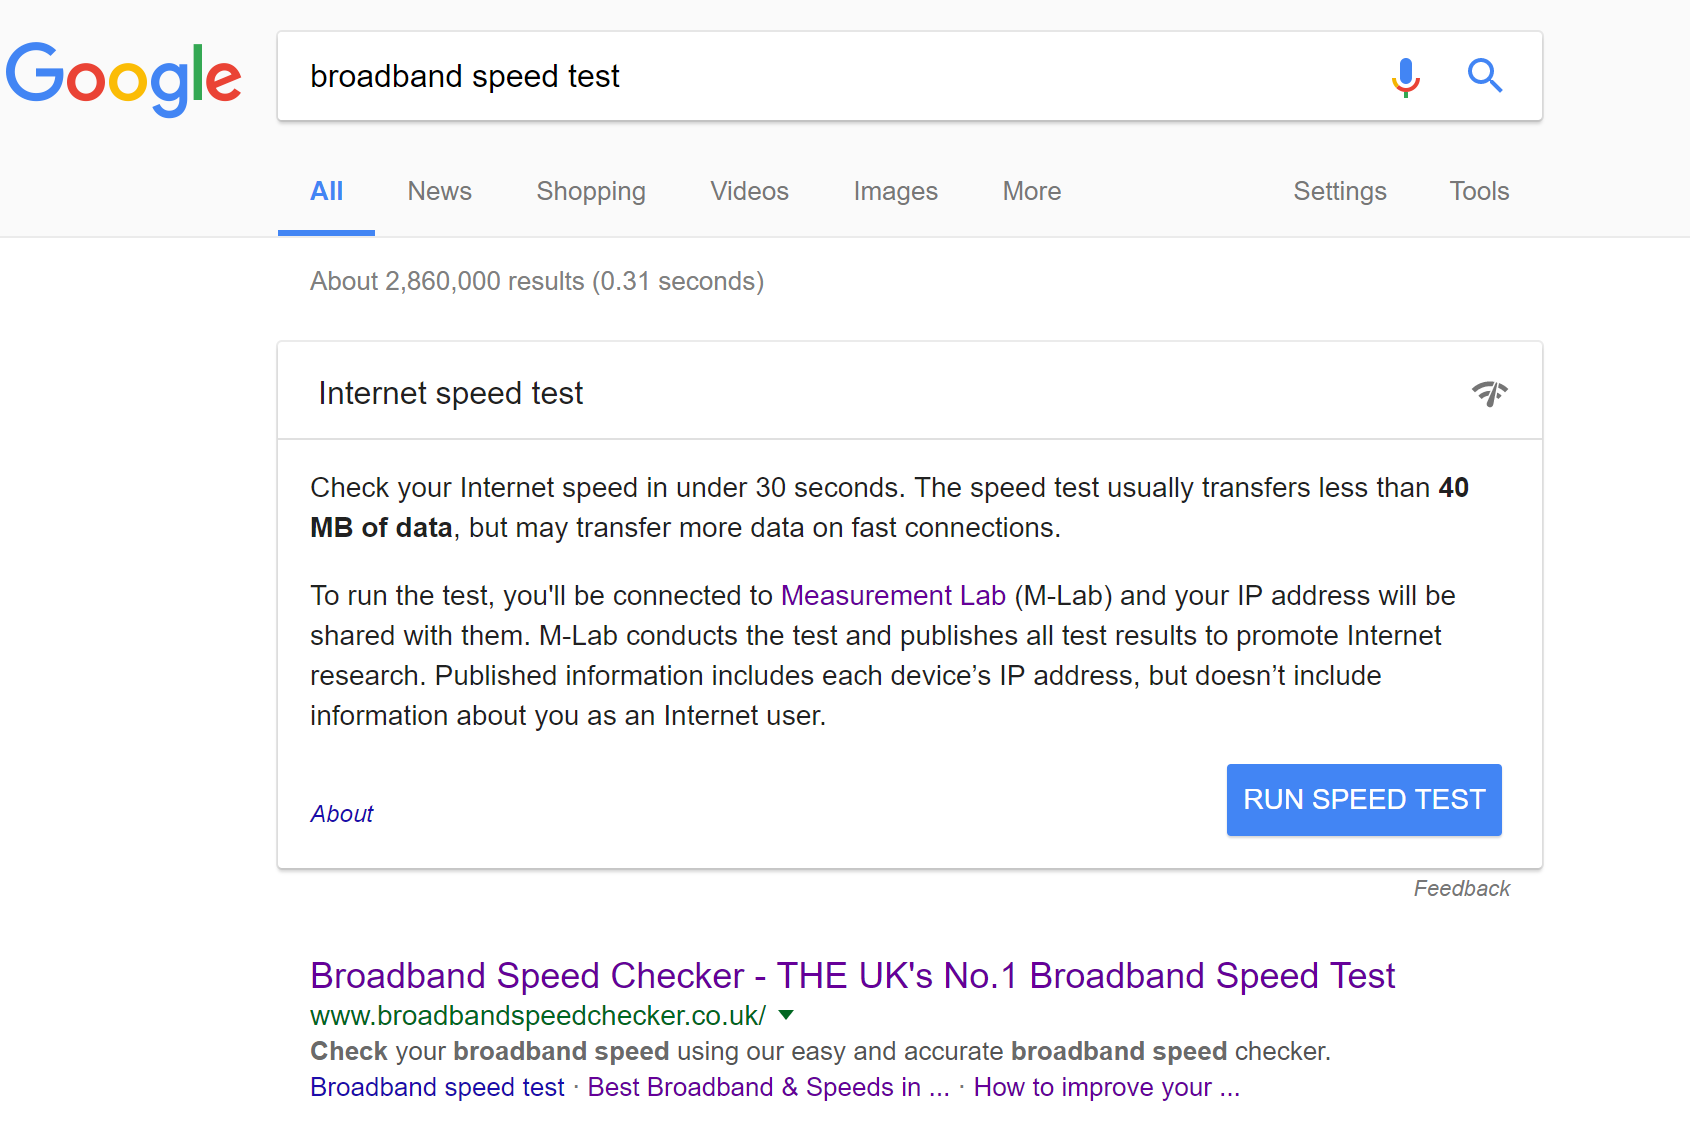
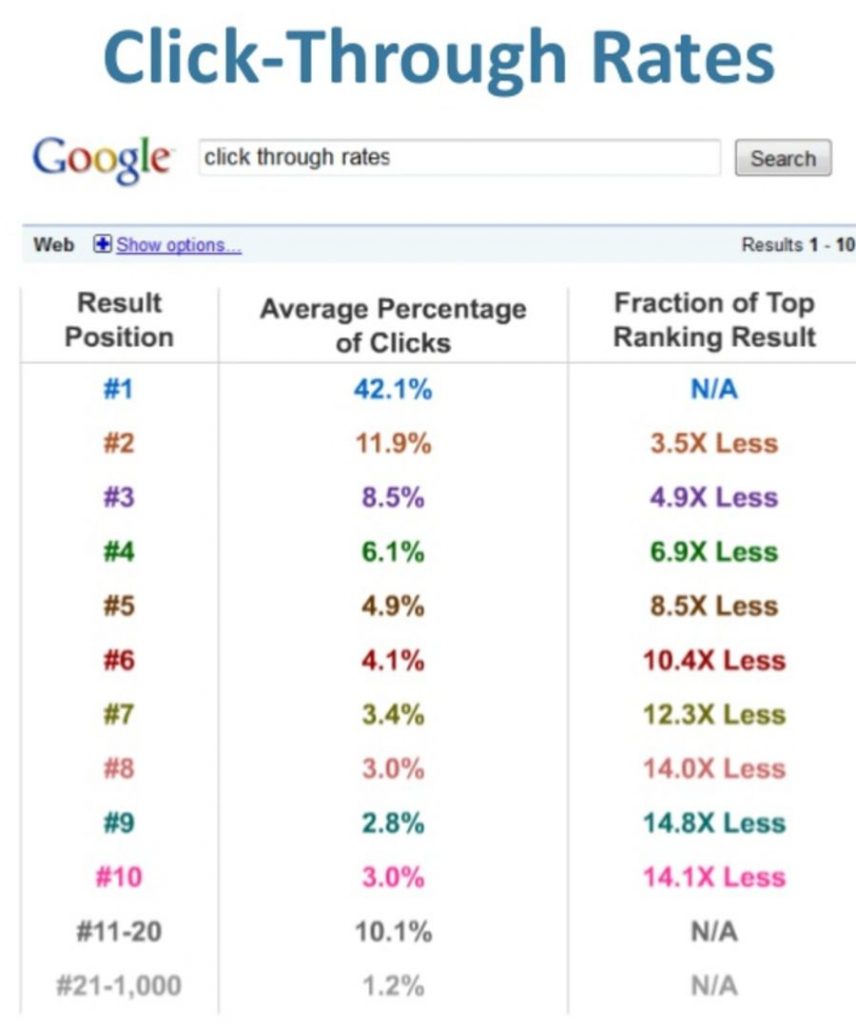
Here is how the search results look like in the UK for one of our main keywords:
broadband speed test Google Search


As we can see Google speed test occupies significant space on the 1st page and pushes all results below.

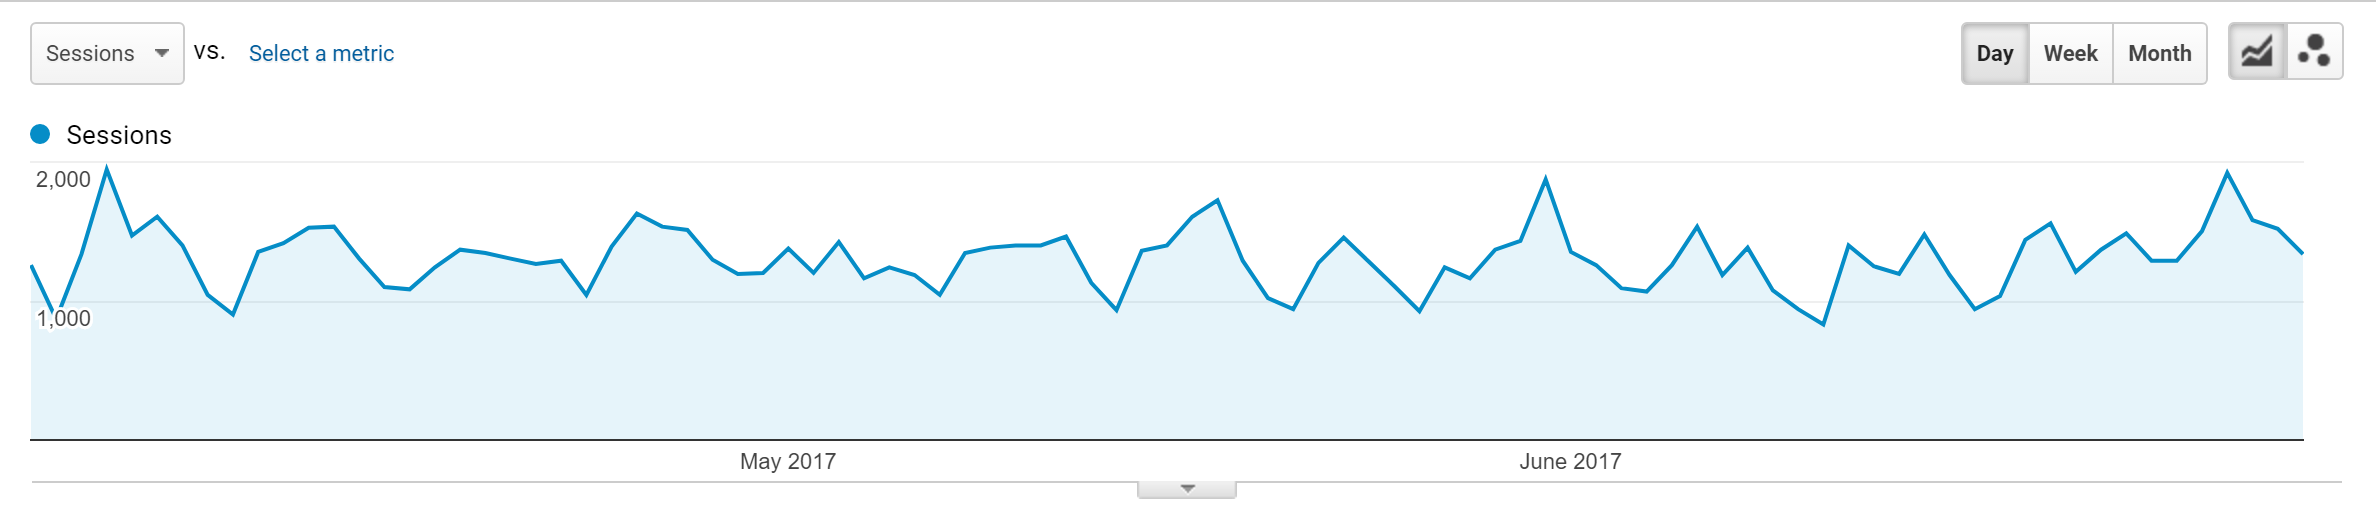
Here is the chart plotting user visits from Google (and Bing for comparison) before and after the Google speed test release. We can observe the drop in visitors begins after Google launches the speed test.


google-vs-bing (1)


To better illustrate that the drop is because of ranking change and not seasonal factors, here is zoomed in data from Bing which does not show any meaningful change before/after 15th of May when Google launched.


bing (1)


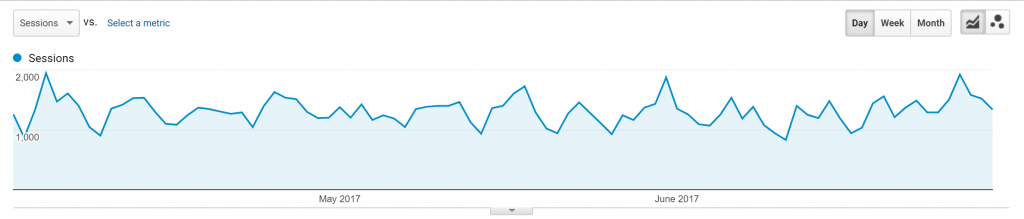
Looking at the average drops we can estimate the loss of about 5000 visits per day from 25000 Google visits. Overall that is about 20% traffic loss from being moved from position 1 to 2.

Comparing to industry standard data e.g. by RankScience, 20% drop is quite a good result, it could be worse.


rankscience


From M-Lab dataset we can also extract quite interesting insights as it contains user IP address as well. If we cross-reference user IPs seen in M-Lab data with our internal data, we can see about 5% of users use both services. We can only speculate whether it’s a good result or not, definitely for the user it is useful to get information from 2 different sources and decide what is more relevant.

Conclusion

From our perspective we are quite happy the Google threat is not as serious as we originally thought. Loosing 10% of our overall traffic (and 20% of Google’s) will have impact on our bottom line but we will survive. Luckily, we provide other features that user’s appreciate such as mobile apps, storing results, mapping, comparisons and more. This I believe contributed heavily to such a small drop. I have no doubt many users will favor convenience of 1 click to get result in search results directly than going to 3rd party site such as ours. Unfortunately, there is nothing we can do to compete with that and stay in business at the same time.

With Google favoring their own speedtest, M-Lab datasets are growing at a rate of almost 1 million results per day and will achieve to serve as many customers in less than a year – something  we have achieved in the last 10 years. That is the power of Google search dominance.