Quality of Service: Lessons from Content Delivery World Conference 2015

content_deliveryQuality of Service: Lessons from Content Delivery World Conference 2015

CDW 2015: The evolution of content delivery architectures and workflows, and their role in distributing content throughout the globe.

In October 2015 Speedchecker hosted a stand at the Content Delivery World Conference 2015. Featuring  influential speakers from Canal+, Time Warner Cable, Wuaki.tv, Sky, Telecom Italia, BT, Telefonica, Cisco, Freeview and others.

This is a summary of the event from Steve Gledhill (Head of Content, Speedchecker Ltd) with focus on how to improve the Quality of Service for the end user.

SAMSUNG CSC
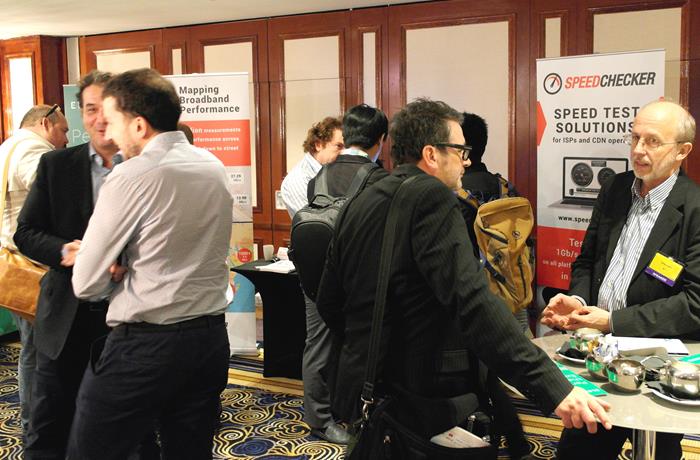
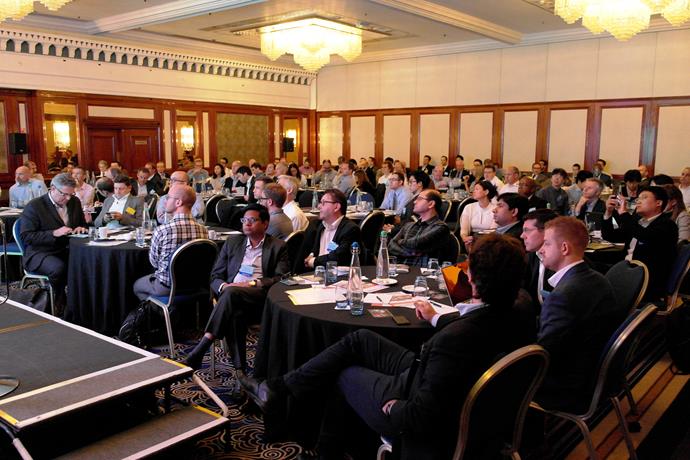
Typical activity between presentations

The Agenda

Content Delivery World 2015 brought together players from across the content delivery ecosystem, enabling the exchange of ideas and innovations and formation of partnerships that will fuel the growth of the content delivery industry, furthering the potential of this multi-billion dollar market.
SAMSUNG CSC
Standing room only

Of particular interest was how to measure the Quality of Experience for the end user rather than only the Quality of Service of the suppliers (CDNs, ISPs and Media Providers). Most of the information that we see regarding the performance of Content Delivery focus on latency, bitrate, throughput and other important factors that relate to the efficient data transmission. We were keen to learn from the key players at the conference how they translate these cold figures into a meaningful Quality of Experience. It was heartening to see that QoE was covered in most of the presentations indicating that this is seen as a key factor in improving the industry moving forward.

Measuring Quality of Experience

During a discussion about the need for multi-CDNs (redundancy, control, independence, QoE, peak traffic management) a number of Key Performance Indicators were listed:

  • Availability
  • Throughput
  • Buffer status
  • Routes taken
  • Bandwidth
  • Latency
  • User experience
  • Video impairments
  • Packet loss
  • Concurrent users
  • User viewing patterns

With regards to QoE it was agreed that “quick enough is good enough”; black screens are unacceptable; less than 2 seconds to switch channels is OK.

VTT in Finland have used user panels to discover how much (or how little) latency and buffering will cause their viewers’ QoE to become unacceptable.

Delivering Quality of Experience

Time Warner reported that they have seen a steady 20% annual increase in the growth of IP traffic year on year and they note that 78% of this is video. In order to cope with this steady increase they see a need for TCP Tuning, OS Tuning, NIC Tuning and a general reduction in the protocol overheads. They see the key metrics need to be captured passively and actively and include the monitoring of the system, analysis of logs and simulated clients.

Alcatel made the point that the CDNs need to be more content aware than they are at the present to ensure the highest quality. They also recommend that each CDN end point should be aware of existing cache to prevent unnecessary delays.

Another common discussion was around variable bit rate. For example, Sky Italia use Adaptive Encoding to ensure that users with 2.4 Mbps experience the same quality as those with 9 Mbs using near real-time encoding. This relies on a high quality original input. This bit rate is managed by the Sky CDN Selector at the Edge Server as close as possible to the consumer.

Orange presented some interesting concerns around certain protocols. Their international CDN provides average speeds of 4Mbps but they feel they have a number of issues to contend with. First, they have issues with caching (many presenters referred to caching as being a key area for improvement). Second, they highlighted the HTTPS issues for carriers under HTTP 2.0. Third, the need to be flexible and responsive to changes makes it hard to provide consistently high quality. Finally, they made reference to the Microsoft Smooth Streaming minimum latency requirement being too high to provide live content as they would wish to.

Multicasting

Looking to the future and how to deal with increased demand and higher quality video BT TV talked about Multicasting. They acknowledge that although they can distribute at speeds up to 12GBs at production that they lose control the closer they get to the customer. They have no control over the Home User’s devices or network; their equipment; the wiring in the home or the core/backhaul network all of which can lead to packet loss. Multitasking reduces the number of individual streams required and thus reduces delays and congestion. They can use the application layer to control dropped packets / retransmission and can even use 2 identical streams via different routes to be combined at the receiver in the home thus providing built-in redundancy. Problems are identified by end to end monitoring of the network data and user behaviour. The break-even point for multicasting compared to unicasting is 500 users or more. Quality of Experience is improved in terms of immediacy, quality and
continuity.

Problems with multicasting: Requires Unicast Tunnelling across Gaps where Multicast is not possible; Speeds can fall to slowest bit rate; Unicasting is recommended in the home/office.

Delivering on Mobile

Aventeq predict that by 2020 the average smartphone contract will allow 5Gb of data to be downloaded each month. This confirms that we need to ensure that the user experience for the mobile user is given high priority when considering QoE.

This emphasis was highlighted by EE when they showcased their 4G video offering showing seamless streaming from dense urban areas, to high speed (legal) motorway driving and in to the countryside and forests of England. They say this is possible because of the UK having an average speed over LTE of 20Mbps – the fastest in the World.

EE also took a different approach to improving QoE by not just dealing with latency and speed but with the actual content. They propose giving audiences to live events the option to see a choice of angles and bespoke statistics. This is available in the home but they propose making this available on mobile devices.

CDNs – Content Delivery Networks

CDNs are the backbone of the delivery mechanism and were a common point of discussion and debate throughout the conference

A number of Media providers are using or developing their own CDN (Content Delivery Network) to ensure that they are in control of the users’ QoE. Canal+ in France have 20-25 Free To Air channels and other services that will be transmitted via their own CDN in the next 12 months. Most of their traffic is driven by Live (premium) content and it is important for Canal+ that they maintain a high QoS for this content. They report that their users complain about streaming that doesn’t launch; video quality issues and buffering in roughly equal measure. Their research shows that download speeds of between 2 and 2.5Mbps are acceptable for the QoE of the end user. These speeds are achieved at all times except for the peak times of 7pm and later when problems start. Canal+ plan to provide their content directly to the ISPs instead of using a CDN as is currently the case. This should save money but they also hope that it will improve users’ QoE.

This lead to recommendations for choosing CDNs:

  • Point of Contact if there’s a problem
  • Excellent throughput and latency performance
  • Live content handling
  • Cloud computing support

Net Neutrality, Copyright and DRM

Most of the discussions and presentations dealt with moving the data around as efficiently as possible with no concern with regard to Net Neutrality. That’s not to say that this is ignored but rather, I suggest, that it is acknowledged that best technical practice needs to be modified to comply with regulations in any and all countries. For that matter, DRM and other copyright issues were only touched upon in a few presentations for similar reasons: the focus of the conference was on efficiency and how the technology can be used and improved upon.
Towards an LMAP Specification of ProbeAPI.

In an effort to bring ProbeAPI nearer to the internet measurement community, we’ve been paying close attention to the new LMAP specification for internet measurement platforms. LMAP is being defined with the goal of standardizing large scale measurement systems, in order to be able to perform consequent measurements among diverse entities. They may even differ in implementation details, but complying to this standard opens the possibility of making the components, results and instructions comparable.

“Amongst other things, standardisation enables meaningful comparisons of measurements made of the same Metric at different times and places, and provides the operator of a Measurement System with criteria for evaluation of the different solutions that can be used for various purposes including buying decisions (such as       buying the various components from different vendors). Today’s systems are proprietary in some or all of these aspects. “ – RFC 7594, July 2015

In order to find out how compliant or non-compliant ProbeAPI might be toward this standard, we started a design and implementation comparison in terms of an LMAP system. In this post we will focus on the general outline of the system, oriented to its main components, their roles and data flow. A detailed comparison for a data model and measurement methods will have to remain pendant for a dedicated post, since they are very extended topics.

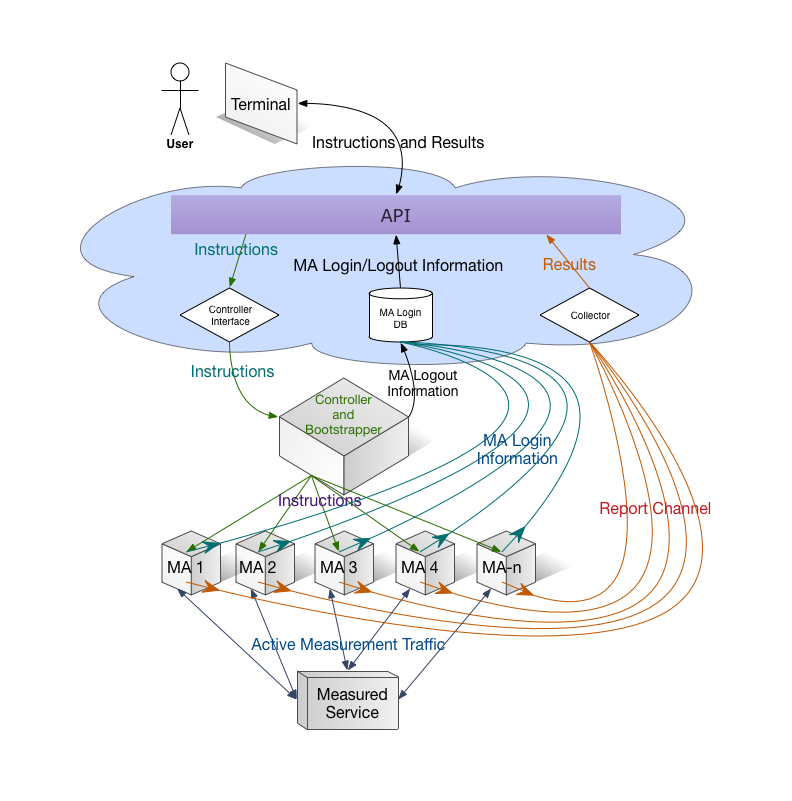
The general working scheme of ProbeAPI includes most components from the LMAP specification in very similar roles:

The user with the API makes a measurement request. The API, hosted in the cloud, then communicates the testing instructions to the Controller Interface, which will forward the testing instructions to the Bootstrapper and Controller outside the cloud. The Bootstrapper part is in charge of integrating the probes to the whole system and updates the database to keep track of the disconnecting probes. It is implemented using an XMPP server, which uses a sleek protocol and allows for all the probes relevant to a particular measurement to receive the message simultaneously.

The probes themselves report their online status directly to the API, while the Bootstrapper keeps track of the ones that disconnect. The probes receive the measurement instructions from the Controller. After carrying them out, they will send the results directly to the API to be delivered to the user.

LMAP Scheme for ProbeAPIThe Controller and Bootstrapper component mixes the Controller part, which is an element inside the scope of LMAP while the Bootstrapper lies outside the LMAP scope.


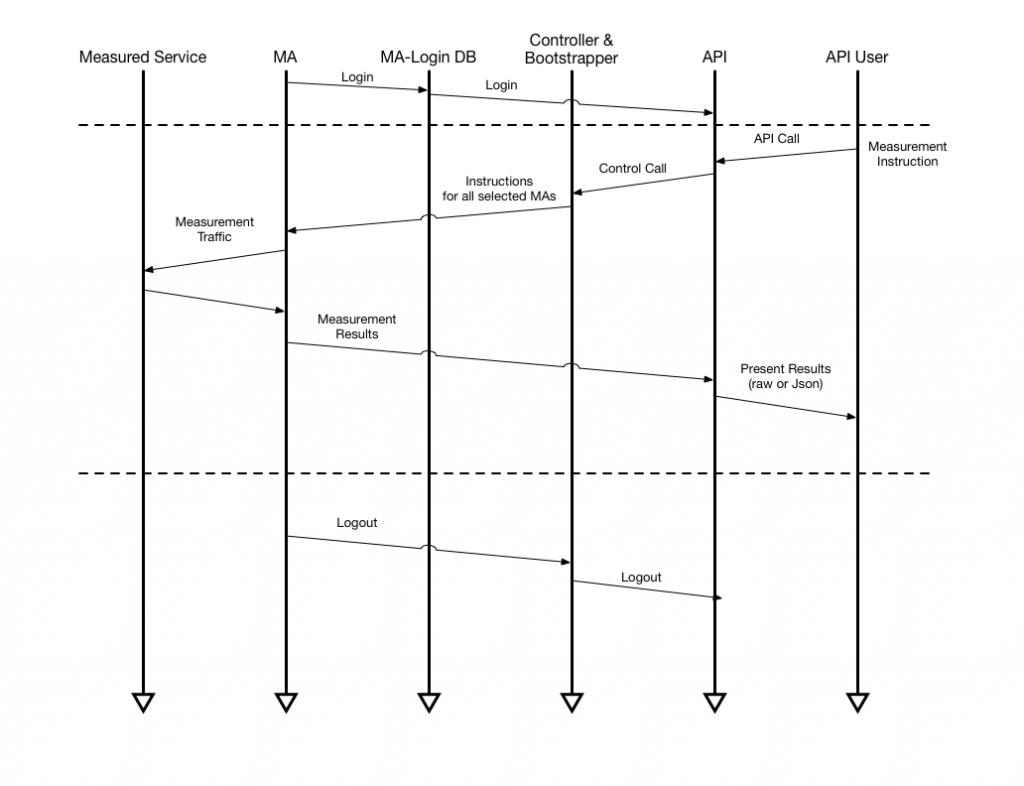
When a new probe becomes online, it generates its own unique ID which will be sent together with the results, where they can be separated in terms not only of ProbeID, but also ASN or Country. Then it calls the login method from the cloud interface so it will be accounted as online. When a Probe logs off, it is the Bootstrapper service which accounts their disconnection to the Database.

Interaction Diagram for MA-Login, Measurement Instruction and MA-Logout.

When a measurement instruction is sent, the Control Protocol is an XMPP instruction which can contain, for example, the following information:

  • <Task-ID>Task-ID
  • <MA-ID>Probe-ID
  • <suppression>TimeOut
  • <instruction>Command
  • <parameter> host_address
  • <parameter> ttl
  • <parameter>count
  • <parameter>timeout
  • <parameter>sleep
  • <parameter>BufferSize
  • <parameter>fragment
  • <parameter>resolve
  • <parameter>ipv6only

There is a Task-ID generated from the API, which is passed over to the probe with each measurement. When the results are collected, they are easily recognized.  Failure information from the Measurement Agents will be included in the results.

Here is an example of the results header obtained for httpget measurements:

  • HTTPGet_Status
  • HTTPGet_Destination
  • HTTPGet_TimeToFirstByte
  • HTTPGet_TotalTime
  • HTTPGet_ContentLength
  • HTTPGet_DownloadedBytes
  • Network_NetworkName
  • Network_LogoURL
  • Network_CountryCode
  • Network_NetworkID
  • DateTimeStamp
  • Country_Flag<url>
  • Country_Name
  • Country_State
  • Country_StateCode
  • Country_CountryCode
  • Probe-ID
  • ASN_Name
  • ASN_ID
  • Location_Latitude
  • Location_Longitude

The possible measurements at the time are:

ICMP (ms) , HTTP-GET (ms), Page-Loading time (ms), DNS Query Time.

The API itself doesn’t offer scheduling functions yet, but they are being implemented. Since ProbeAPI’s measurements are active. Each MA measures normally one flow per instruction. The report Data can be presented Raw or formatted in Json. There are also plans to implement scheduling also for reports. Right now reports are immediate.

There is also no Subscriber Parameter DB, since this information is delivered directly with the results from the probes. AS-Number, Country, AS-Name and Geographic Location are provided directly with the results.

A study on the coverage of ProbeAPI and RIPE Atlas

Ripe Atlas has been successful in establishing a fairly well extended network of measurement Probes. They are placed in different environments, which can be server rooms, volunteers ‘offices, universities and households. Since the placement of a probe requires a physical device to be installed, the deployment and growth rate of the network is limited to the available physical distribution capacities and the cost of producing enough physical devices. On the flip side, this quality of being a hardware based measuring platform, not only guarantees a stable availability of the probes, but also there is a genuine piece of hardware that allows any customizations the measurements may require.

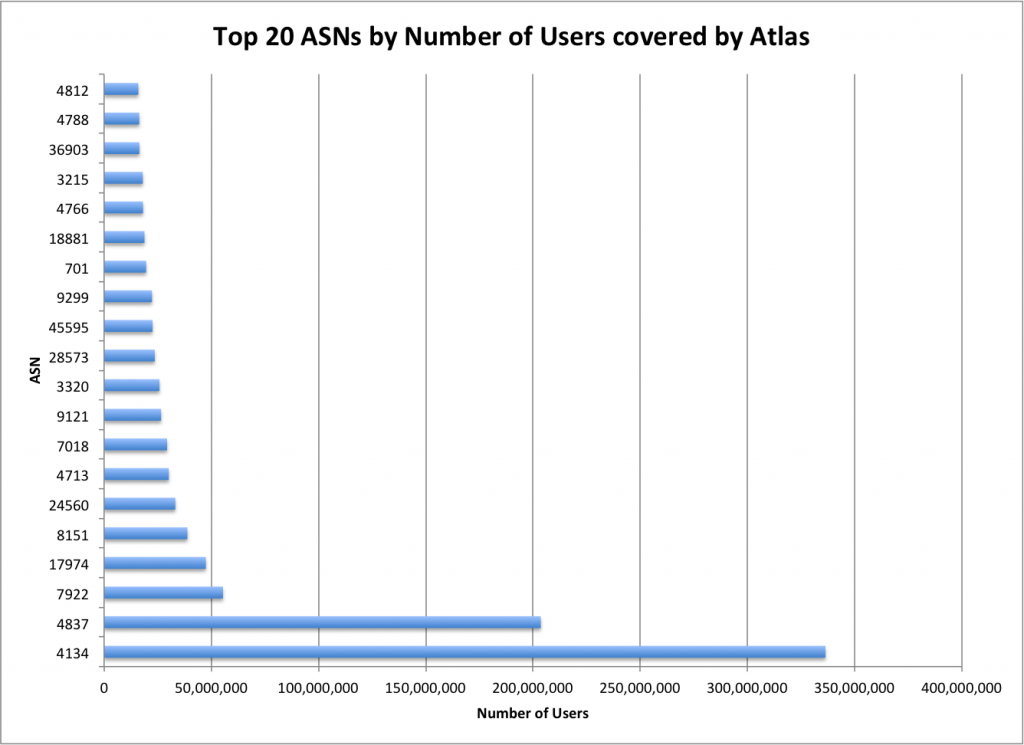
Top 20 Atlas by Users

Although Atlas has already achieved an impressive number of deployed probes, there are still large networks in need of coverage.

ASN Country(ISO 2 letter code) Users(APNIC Labs estimate) RIPE Atlas probes(online)
AS4134 CN 336 million 2
AS4837 CN 204 million 0
AS9829 IN 66 million 0
AS7922 US 55 million 336
AS17974 ID 47 million 1
AS8151 MX 39 million 4
AS24560 IN 33 million 5
AS8452 EG 33 million 0
AS4713 JP 30 million 8
AS7018 US 29 million 40
AS9121 TR 27 million 8
AS3320 DE 26 million 206
AS28573 BR 24 million 20
AS45595 PK 23 million 1
AS9299 PH 22 million 5
AS9808 CN 21 million 0
AS701 US 20 million 80
AS45899 VN 19 million 1
AS18881 BR 19 million 8
AS4766 KR 18 million 8

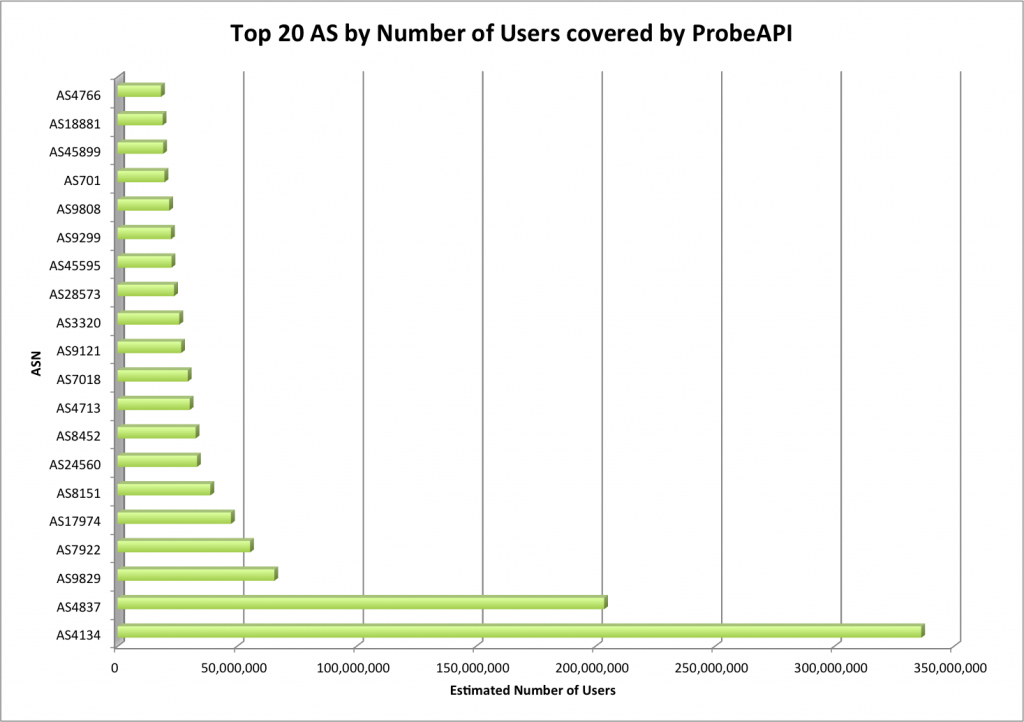
In this respect ProbeAPI can provide much relief. Because of its software-based nature, it has many complementary features that provide very interesting strategic flexibilities. For example, its deployment has a very low cost: it only requires the installation of a piece of software on a Windows computer. Being able to measure real user’s connectivity is a big advantage, but at the same time the normal usage of computers make ProbeAPI instances very volatile: personal computers go on and offline for different reasons during their normal usage.

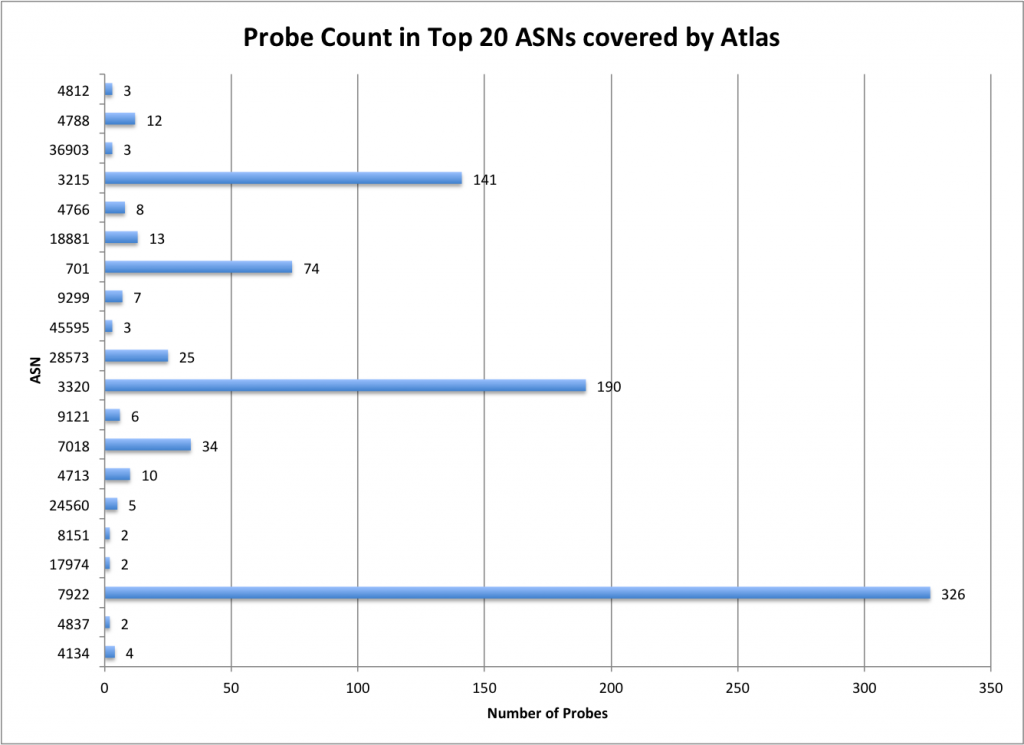
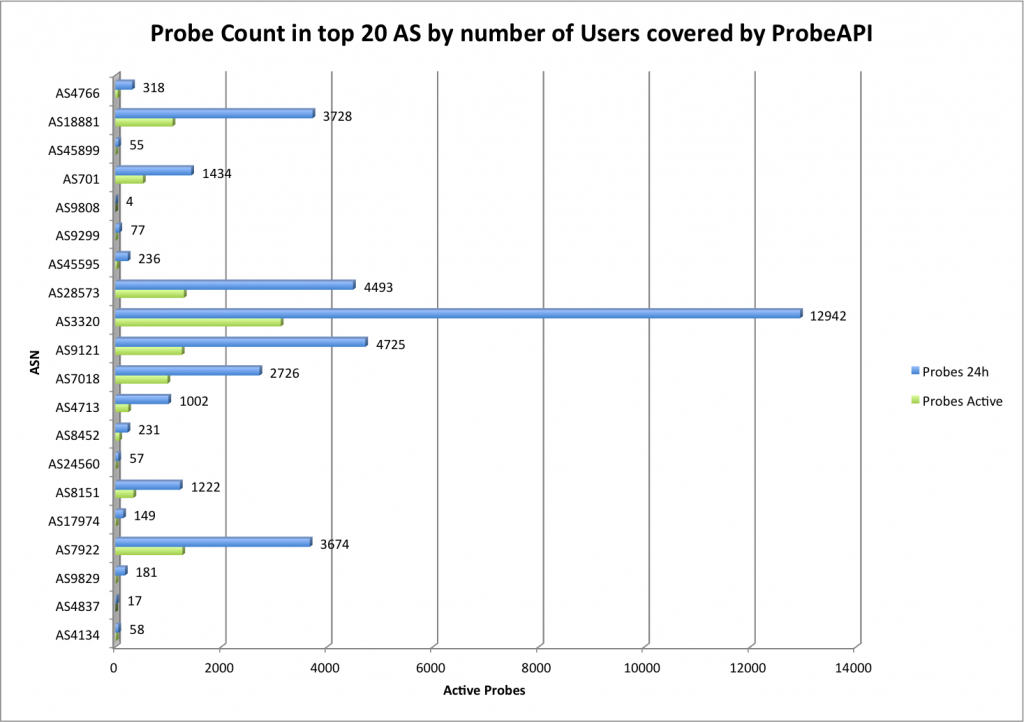
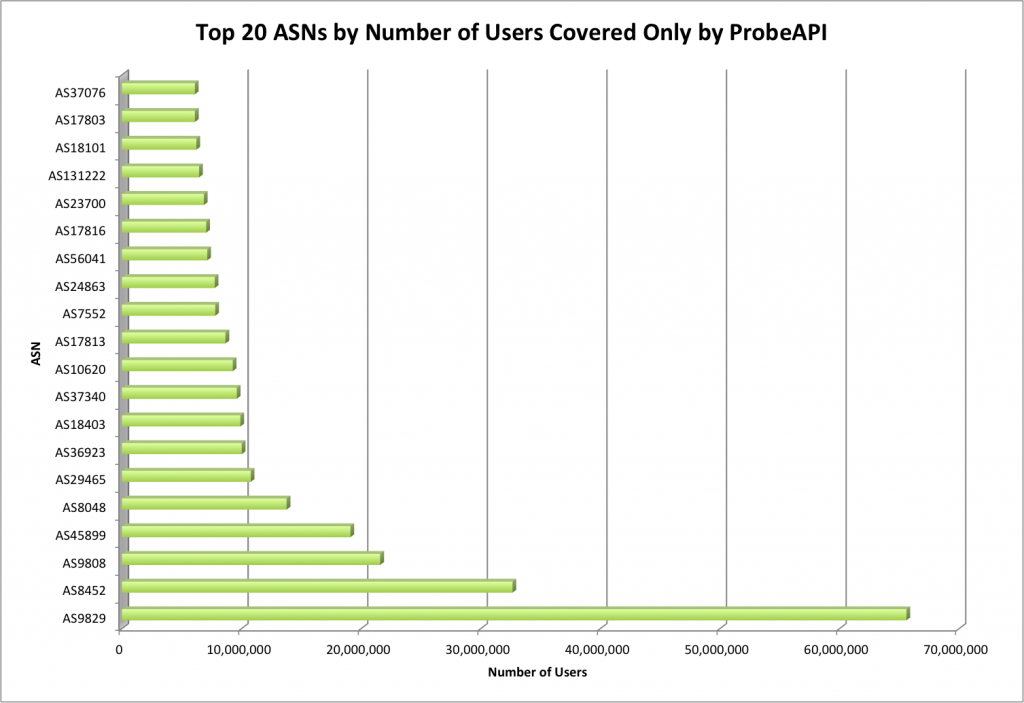
We can note by observing both graphs, that there are still large networks with little coverage from ProbeAPI. ASNs 4134 (China Telecom), 4837 (China-168) and 9829 (India Telecom) are good examples of large networks with a comparatively small number of probes.

Nevertheless, ProbeAPI’s easy deployment gives us the possibility to be present in networks where too little or no physical probes have been installed.In our measurements, the number of available probes in ProbeAPI at a given moment is around 84000. During a normal usage day, more than 290000 became online. Although not all probes are online all the time, the number of available probes at a given moment is almost 8 times RIPE Atlas’ active probe count. This counterweighs the volatility problem of ProbeAPI’s instances, but for longer measurements from a static set of probes, the stability of Atlas Probes is an important fact to take into account.

It is important to remark that this comparison does not intend to establish technical superiority of one system or the other. Quite at the contrary, during this analysis we realized that in this respect, Atlas and ProbeAPI may contribute complementary features for measuring networks. For low-coverage, physically or politically hard to reach networks, a software solution like ProbeAPI may be a viable alternative in order to be able to first expand our general measurement coverage. Once a region starts installing more Atlas probes, longer measurements with fixed sets of probes become available thanks to Atlas’ more stable probes.

In this stage ProbeAPI’s end-user perspective can provide the convenient point of view of the last mile’s conditions. Combining the stability and precision of Atlas’ probes, with the massive amounts of possible measurements from end-user perspective, we can get a very well detailed portrait of the network’s condition.

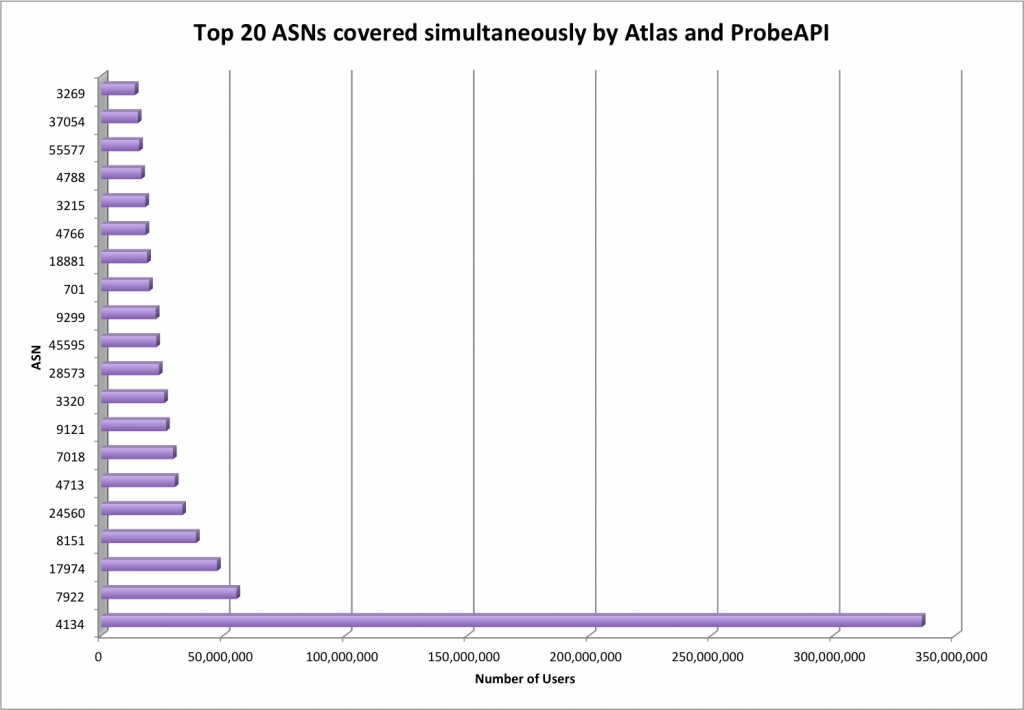
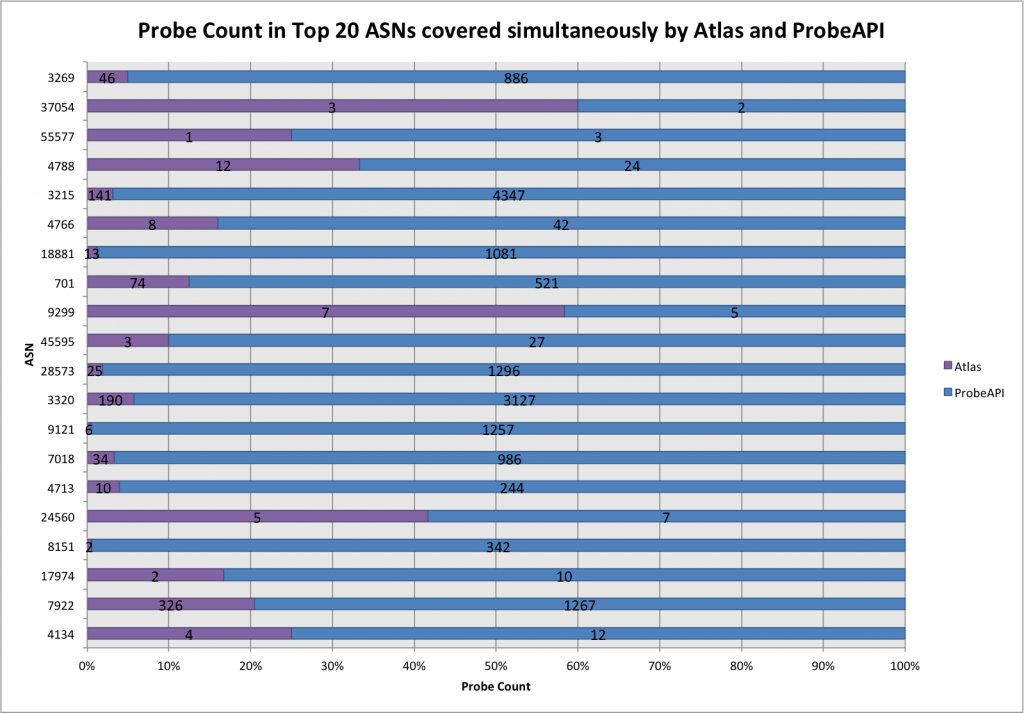
Currently there are around 74000 active probes from ProbeAPI and Atlas monitoring the same ASs. ProbeAPI has around 14000 probes measuring networks where Atlas isn’t present. On the other side, Atlas has around 1700 probes where ProbeAPI is absent. Combined they give a grand total of around 95000 active probes able to measure networks serving almost 2.9 Billion users.

 Conclusion

The software-based design of ProbeAPI helps us achieve a vast coverage, even achieving the impressive number of 4000+ available probes for a single AS. Of course, the natural instability of the probes is an inherent constraint of ProbeAPI’s architecture, but that is the trade-off in exchange for a very extended and fast growing measurement network.

On the other hand, RIPE Atlas is designed around physical devices installed in diverse locations by hosts. This physical design brings the inherent stability a physically independent device can provide. Probes can be placed strategically in different points of the net other than only end-users, where measurements can reveal valuable information about the net’s conditions. All This requires some host recruiting, so this distribution process is naturally slower than a software one.
There are essential architectural differences between ProbeAPI and RIPE Atlas. Both systems were designed with a similar set of measurement features in mind, but their differences in design end up opening different doors, which in return give us the possibility of observing the net from a large number of diverse vantage points.