Choosing an optimal server location isn’t necessarily an easy task. Managing costs and selecting an appropriately sized hosting package is just one part of the deal. As much or more important than server capacity, is finding out how your services behave from your client’s perspective. Whether it is for choosing among different hosting providers or deciding in which location it is better to deploy your server, you need to measure latency and throughput. Having an insight into these two metrics can improve your service and result in cost-effective solutions.
In this article, we take a look into these two basic aspects of connectivity: latency and throughput. We discuss their behavior and show you how to use CloudPerf to compare and choose an optimal server for deploying a web page.
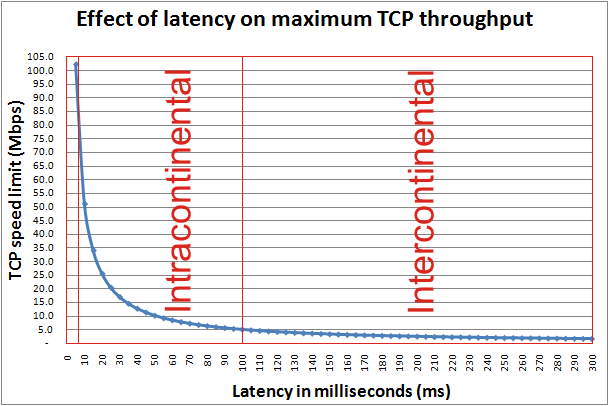
As we know, TCP performance is naturally limited by Latency. As for this, the first aspect we have to look into a server’s performance is Latency, then focus on throughput. No matter how big a link may be, if your users experience a high latency, it is not possible for them to achieve high performance. The next graph, shows the interdependency of Thoughput vs. Latency.
Here we can observe an inverse exponential curve, which in practical terms, it means that especially in the 1-30ms range, every millisecond of latency will have a heavy effect on the maximum achievable performance. With this in mind, we can picture very clearly the intuitive notion of choosing a server as close as possible to your clients, but still take into account even the smallest differences in latency.
Let’s say we have an account with a cloud provider and we want to deploy a service for European users. We can take Digital Ocean as an example, where we can deploy a VM in Amsterdam, London or Frankfurt, among others. We deploy the same test service on each of those locations. Then we set up a Static Object measurement for them in CloudPerf pointing to a 100KB test file and a Ping measurement to each server. We make sure to select the countries of our interest and start measuring. We choose to measure for one hour, one measurement per minute.
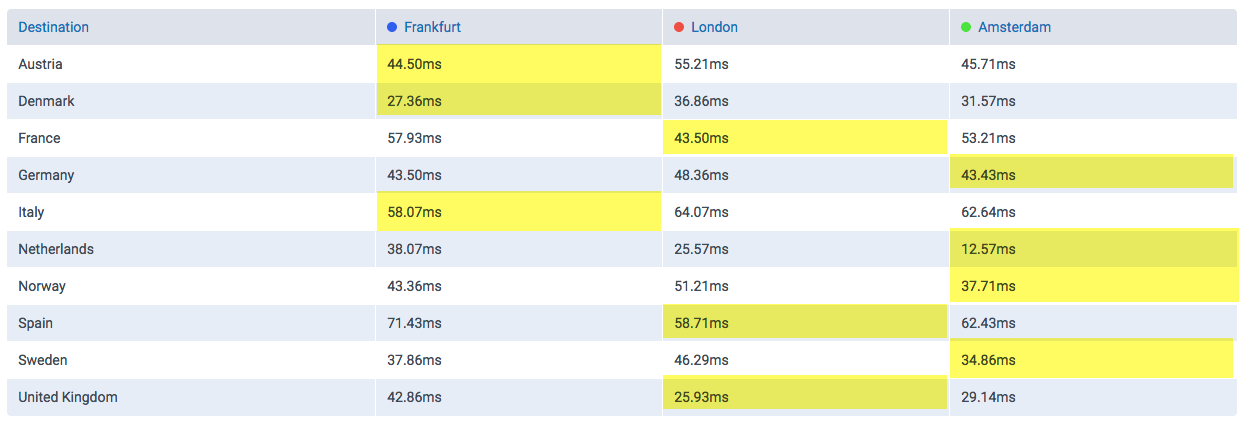
The following table shows the latencies obtained from each location to each of the three servers. The lowest latencies have been highlighted in yellow.
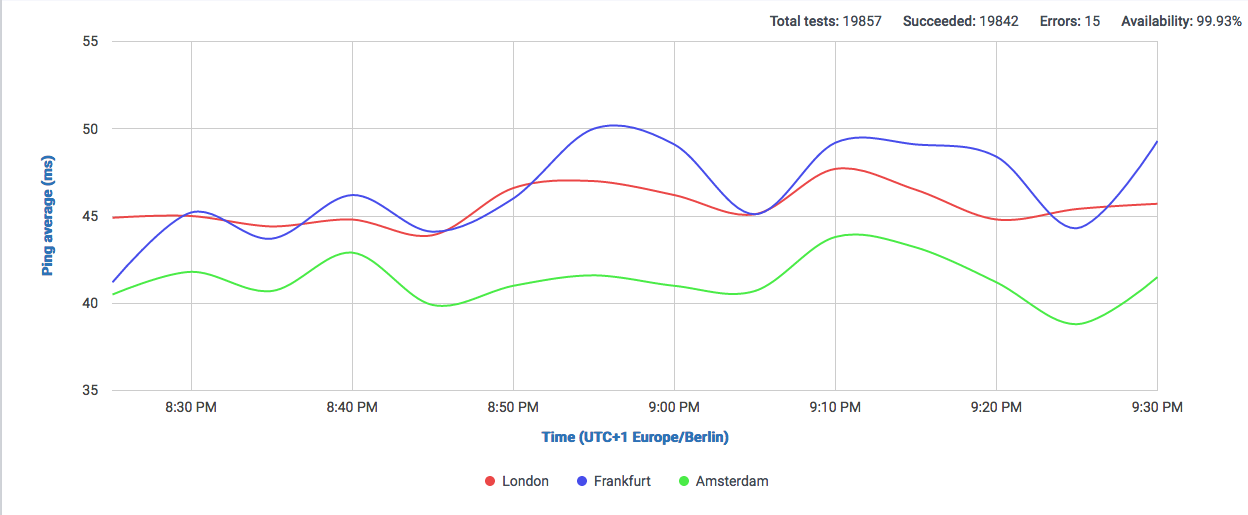
We can observe that depending on the countries we are serving to, we can expect a very different result for each server. But focusing on all countries altogether, we can say that Amsterdam and Frankfurt have the lowest latencies in general. Let’s confirm that with the graph:
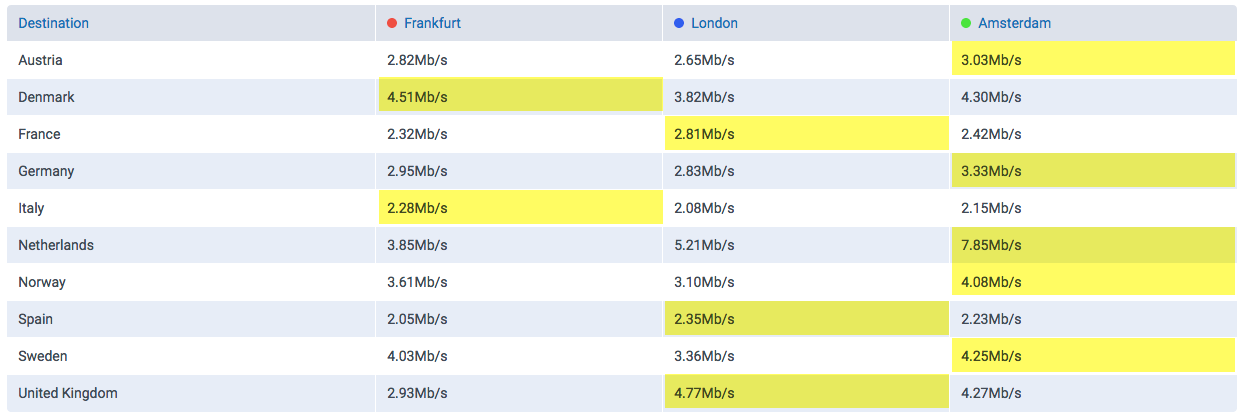
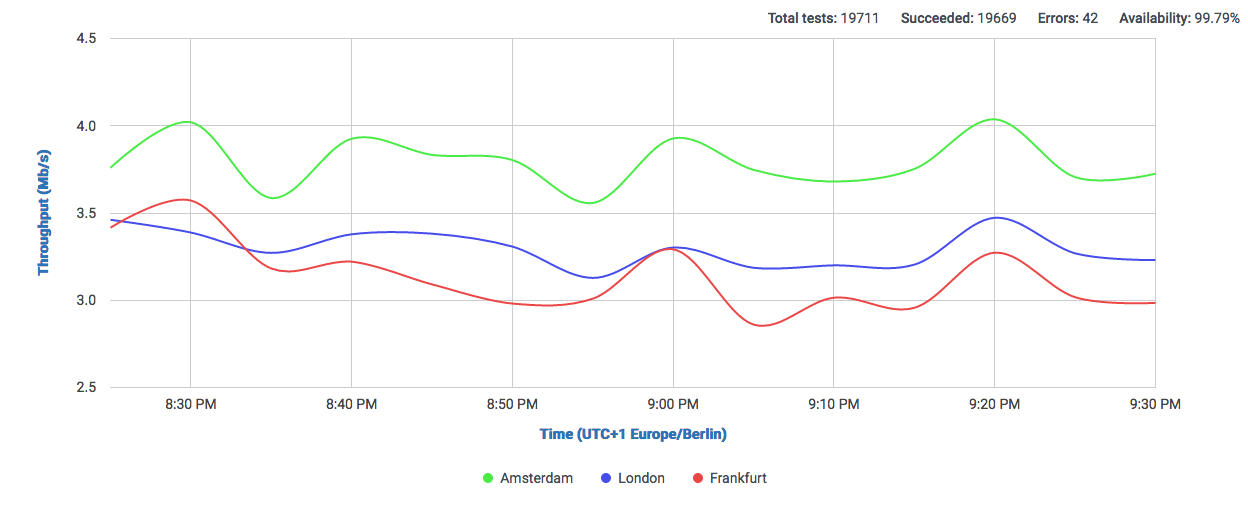
This is one for latency, but what about throughput? Given similar enough latencies, like in this case, the effective TCP Throughput may be affected by other factors, so we take a look at the download speeds achieved for each server, now the highest Throughput has been highlighted in yellow.
Here we can clearly observe that clients from Austria and Germany, which showed ping values favorable to the Frankfurt server, actually show a higher throughput when serving from Amsterdam. Let’s take a look a the graph:
No we have confirmed that our Amsterdam server will show the best performance. Of course results will vary depending on which countries we focus on, but we can clearly see a general advantage of using Amsterdam as a single location for this selection of countries.
