In this tutorial we show you a practical application of CloudPerf, which is measuring and comparing CDNs. Since nowadays the CDN market is bigger than ever and equally diverse, we think it is very important to be able to compare and analyse CDN performance using an independent measurement platform before making any decision. This way you can see and compare by yourself using the same measurements across all providers of your interest.
It is important to take into account, that CloudPerf makes last-mile measurements, that is, right there where your users are. That is especially useful to contrast what CDNs or other providers say about their services and what your users are actually experiencing in real time.
Preparing your setup
- Make sure you have an account with CloudPerf, if not, you can get a free trial account on this link.
- Make a list of all the URLs you would like to measure directly from your site. In this example we will use only one url to compare with four CDNs.
- Make sure to compare a copy of the same file across all destinations.
- Make sure all your URLs use the same protocol (http or https).
- Set up your test domains for measuring your service with your desired CDN. You can get trial accounts on most CDNs. You can also setup a series of subdomains for testing many different CDNs with your content. So subdomain1.mysite.com is linked to CDN-1, subdomain2.mysite.com is for CDN-2 and so on.
- Confirm that all your testing sites are using similar DNS configurations. CNAME cascading can affect measurements greatly and lead to unrealistic results.
In general, keep in mind that for testing purposes, it is best to configure all links as similarly as possible. Depending on the options each CDN gives, most of them can also provide test files for comparing their services. Some of these test files can also be found in the web. Nevertheless, we think that measurements are more meaningful if you test directly with your content. Especially if your site mixes cached and uncached content or if your site updates frequently, caching times become more relevant in the equation.
* NEW * – CloudPerf now offers pre-configured links to popular CDNs for your convenience. Just click the drop-down menu on the “Create New Benchmark” button in the Dashboard and select “CDN Benchmark”. The benchmark editor will now include a list of checkboxes with popular CDNs so you can compare your own destinations with our current selection of CDN providers. We will be adding more and more CDNs with time!
Configuring CloudPerf
In this example, we will set up a comparison between one static object against 4 CDNs. Once you have everything prepared, log in to CloudPerf and you will be taken to the Dashboard. Click on “Create new Benchmark”. You will be taken to the benchmark editor.

We name this benchmark “CDN Test”. We chose to measure a Static Object, but this example is also valid for using Page Load. Since we want to run the test for some hours, a 5 minute frequency is OK. For longer or permanent tests, you may want to measure less often. We select a number of countries in which we are interested to run the measurements.
CloudPerf uses a technique we call “Connection pre-warming”, in which two subsequent requests are made with every measurement: the first request will need DNS resolving and therefore will report longer measured times, while the second request has already a resolved DNS and will only report the connection time to the server. You have the option of including the DNS lookup time in your results.
This time we choose not to include DNS lookup times in our measurements, so we can observe in our results the “pure” connection time to our destinations.
For the first destination, we input the direct link to our origin server against which we will compare the CDNs’ performance. We chose to name it “Origin” and under URL we input naturally the direct link to the file we will test. Click on “Add new destination” and another line will appear. We name this and the subsequent lines with the CDN’s respective names, in this case, we simply numbered them. In the URL box we put either the address of the subdomain you previously configured to work with your site or any other link to a static object or web page to measure. For this post we compared one of our homepages with four real CDNs serving the same file.
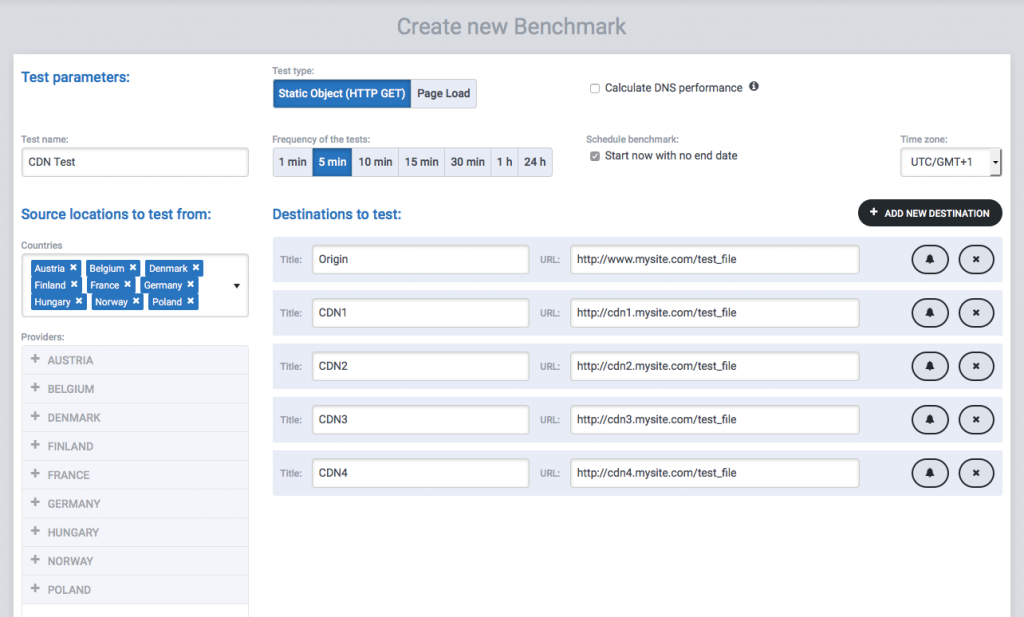
Click on “Save & Update” and voilà! We have configured our benchmark to measure our site and some CDNs simultaneously from thousands of different locations. We only have to wait now and take a look at the results after enough samples are taken.
Viewing Results
If enough time has passed, our first results will be ready. We simply log back into CloudPerf and once in the Dashboard view, we click our measurement’s name, which will take us to the results page.
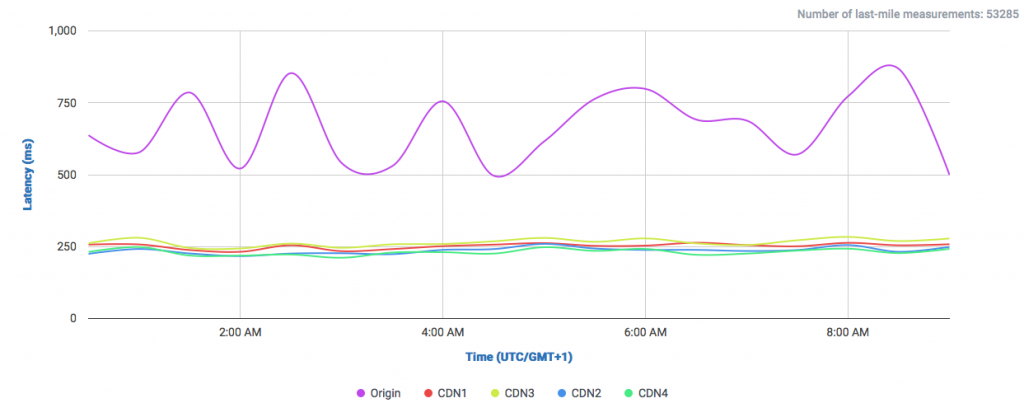
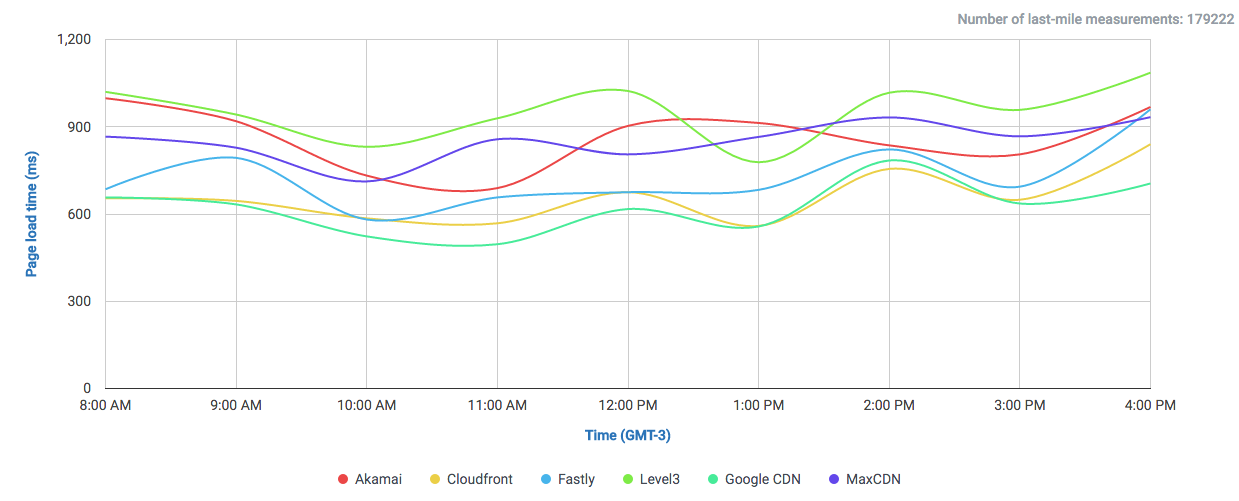
By default we see first the latency measurement graph. The first thing we can notice from these results is that using any of those CDNs will make our website more responsive.
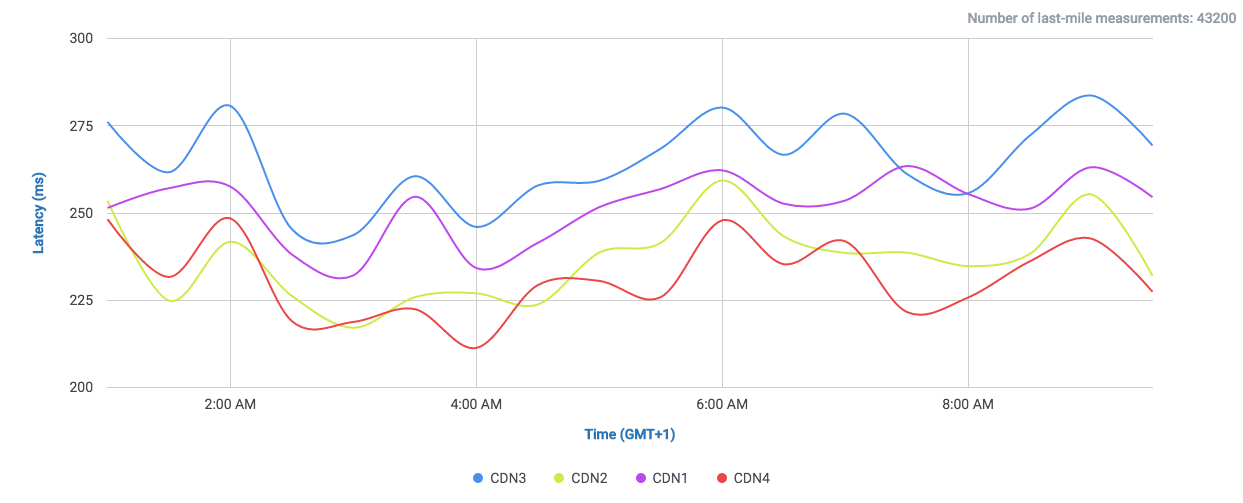
If we remove the origin from the graph using the destinations buttons, since it is the slowest URL in this experiment, the graph will automatically zoom in and you will be able to observe and compare all four CDNs much more clearly. Please note the color change of the graph lines after modifying the destinations.
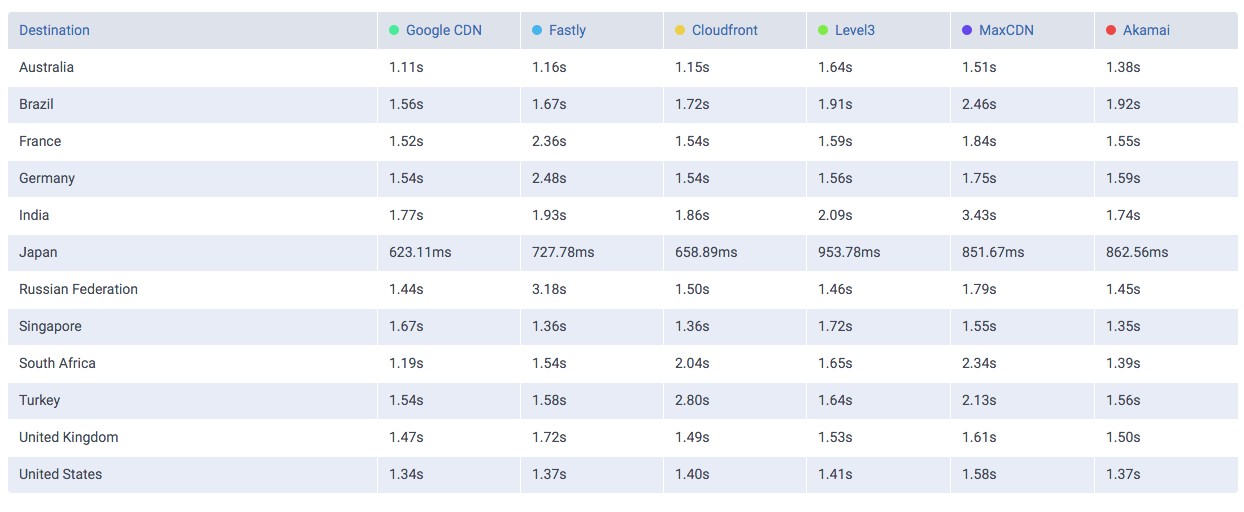
You can use the results table below for having a first look at the measured latencies by country.

If you wish to see the measurements over time in the countries of your interest only, you can select them using the Tests Running From field. You can also switch the graph between destinations and location using the Group By option.
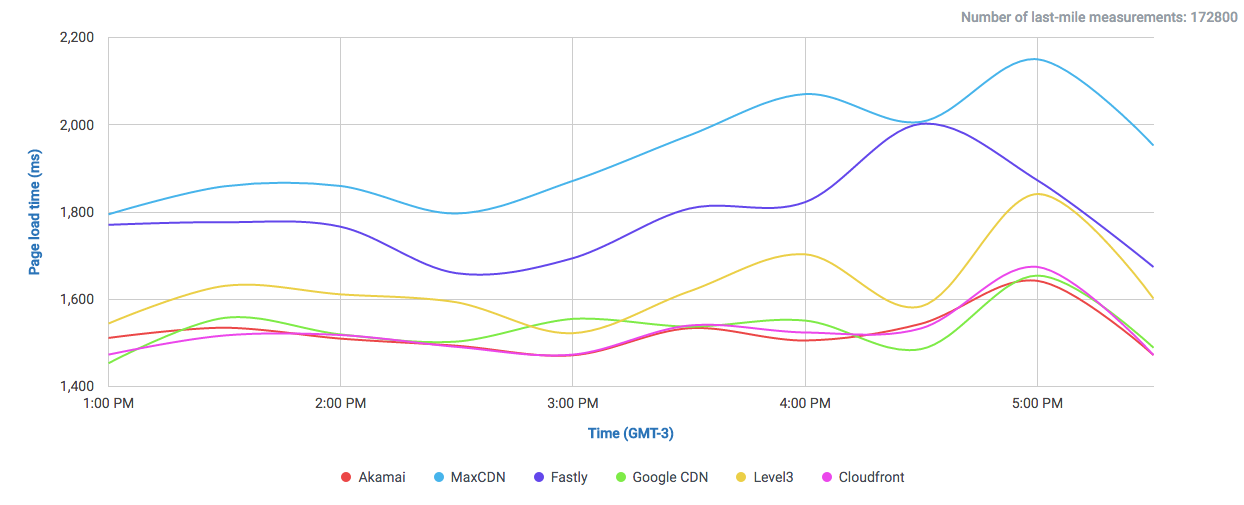
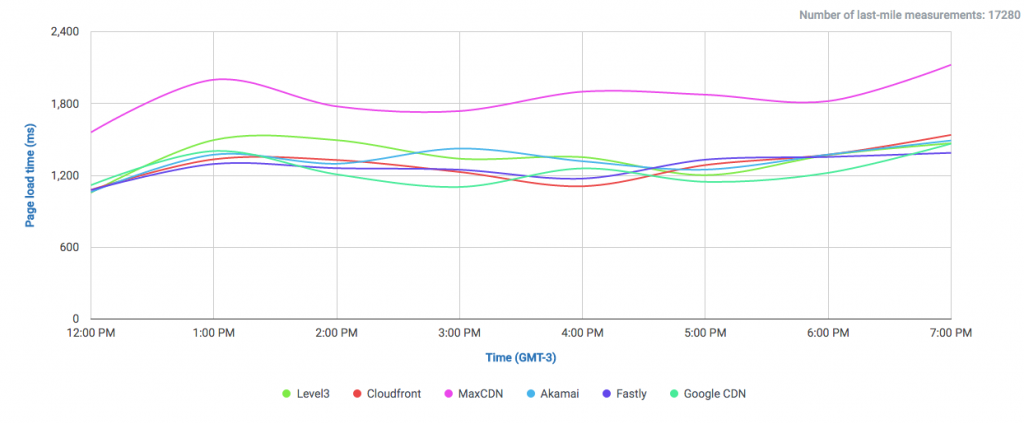
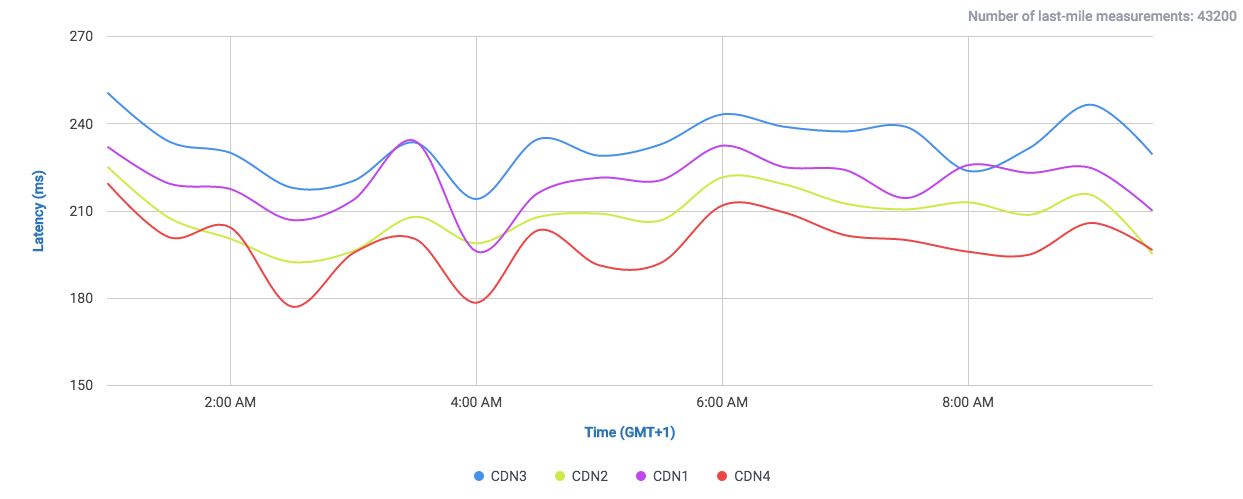
It may be very intresting to compare results using different statistics. For example, if we select the 25th Percentile (faster connections) we can observe that CDN4 clearly outperforms the other three CDNs:
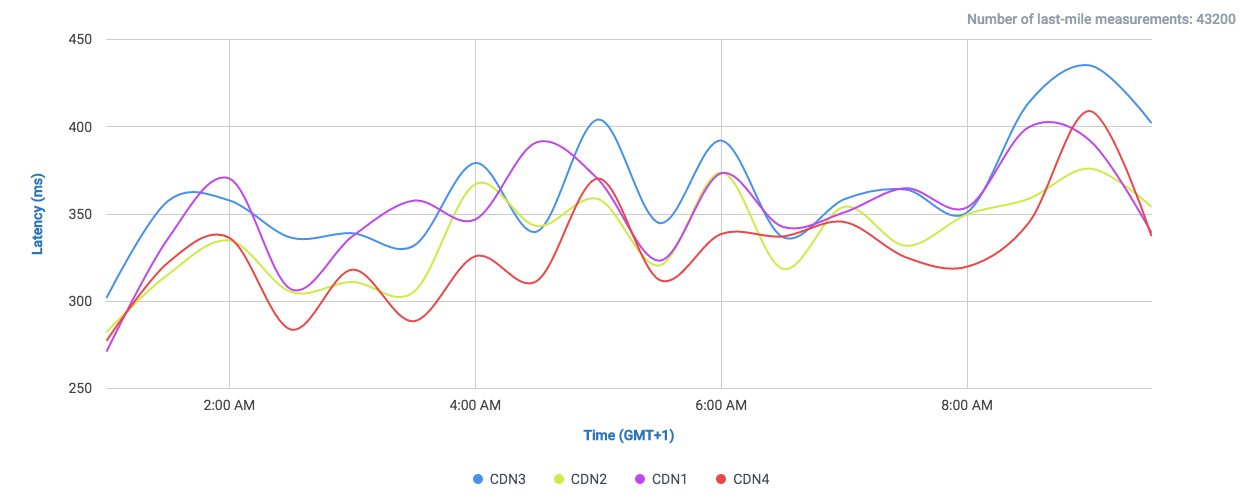
while selecting the 95th Percentile (slower connections) our results show us longer latencies, but less clear differences between CDNs, although maintaining the general tendencies among them.
Remember that CloudPerf is a very flexible tool and can be used for much more than measuring CDNs. Please take a look at our Quick User’s Guide and explore all the powerful options that CloudPerf has to offer!
Sign up now!
